
Providence decision surfaces
Teams make the calls that move the insurer.
Providence simulates a complete general insurer in a competitive market. Teams make real operating decisions with imperfect information, then see how those choices compound—in the portfolio, the accounts and enterprise value.
Decision map
What teams decide—and where the consequences land.
Portfolio Management
Pricing
Team decision: Motor and Home rate settings by visible pricing group, plus new-business discount.
Consequence: Demand, market share, risk mix, GWP, loss ratio and acquisition economics.
Portfolio Management
Underwriting
Team decision: Quote strictness and appetite by risk tier.
Consequence: Eligibility, portfolio shape, claims exposure and the profitability that appears after experience develops.
Claims Management
Claims strategy
Team decision: Settlement approach, review intensity and repair-network model.
Consequence: Leakage, severity, handling cost, payment timing, LIC and customer experience.
Transformation Office
Capability investment
Team decision: Which capabilities to fund and in what sequence.
Consequence: Information quality, pricing cadence, fraud response, forecast discipline and operating flexibility.
Reinsurance
Program design
Team decision: Quota share and excess-of-loss structure by line.
Consequence: Ceded margin, recoveries, volatility protection, capital relief and reinsurance assets.
Capital Management
Distribution and adequacy
Team decision: Dividend level relative to available capital and regulatory headroom.
Consequence: Regulatory headroom, supervisory pressure, shareholder returns and room to keep growing.
Investment Portfolio
Asset allocation
Team decision: Asset allocation across cash, government bonds, corporate bonds and equities.
Consequence: Investment income, liquidity, market risk, capital charge and resilience under stress.
Management Guidance
Public commitment
Team decision: Whether to guide the market and the range to stand behind.
Consequence: Credibility, investor expectations, valuation response and the debrief when actuals arrive.
Market Intelligence
Evidence and competitor readout
Team decision: Whether to invest in better evidence and how much competitor detail to purchase.
Consequence: Diagnostic precision, competitive visibility and the confidence to act before the market moves.
Decision surfaces
Teams decide now. The insurer feels it later.
The panels below show how Providence turns each operating judgement into a working surface. These are not dashboards—they are where teams make their call, commit to it and later see what that call did to performance.
Portfolio Management
Pricing
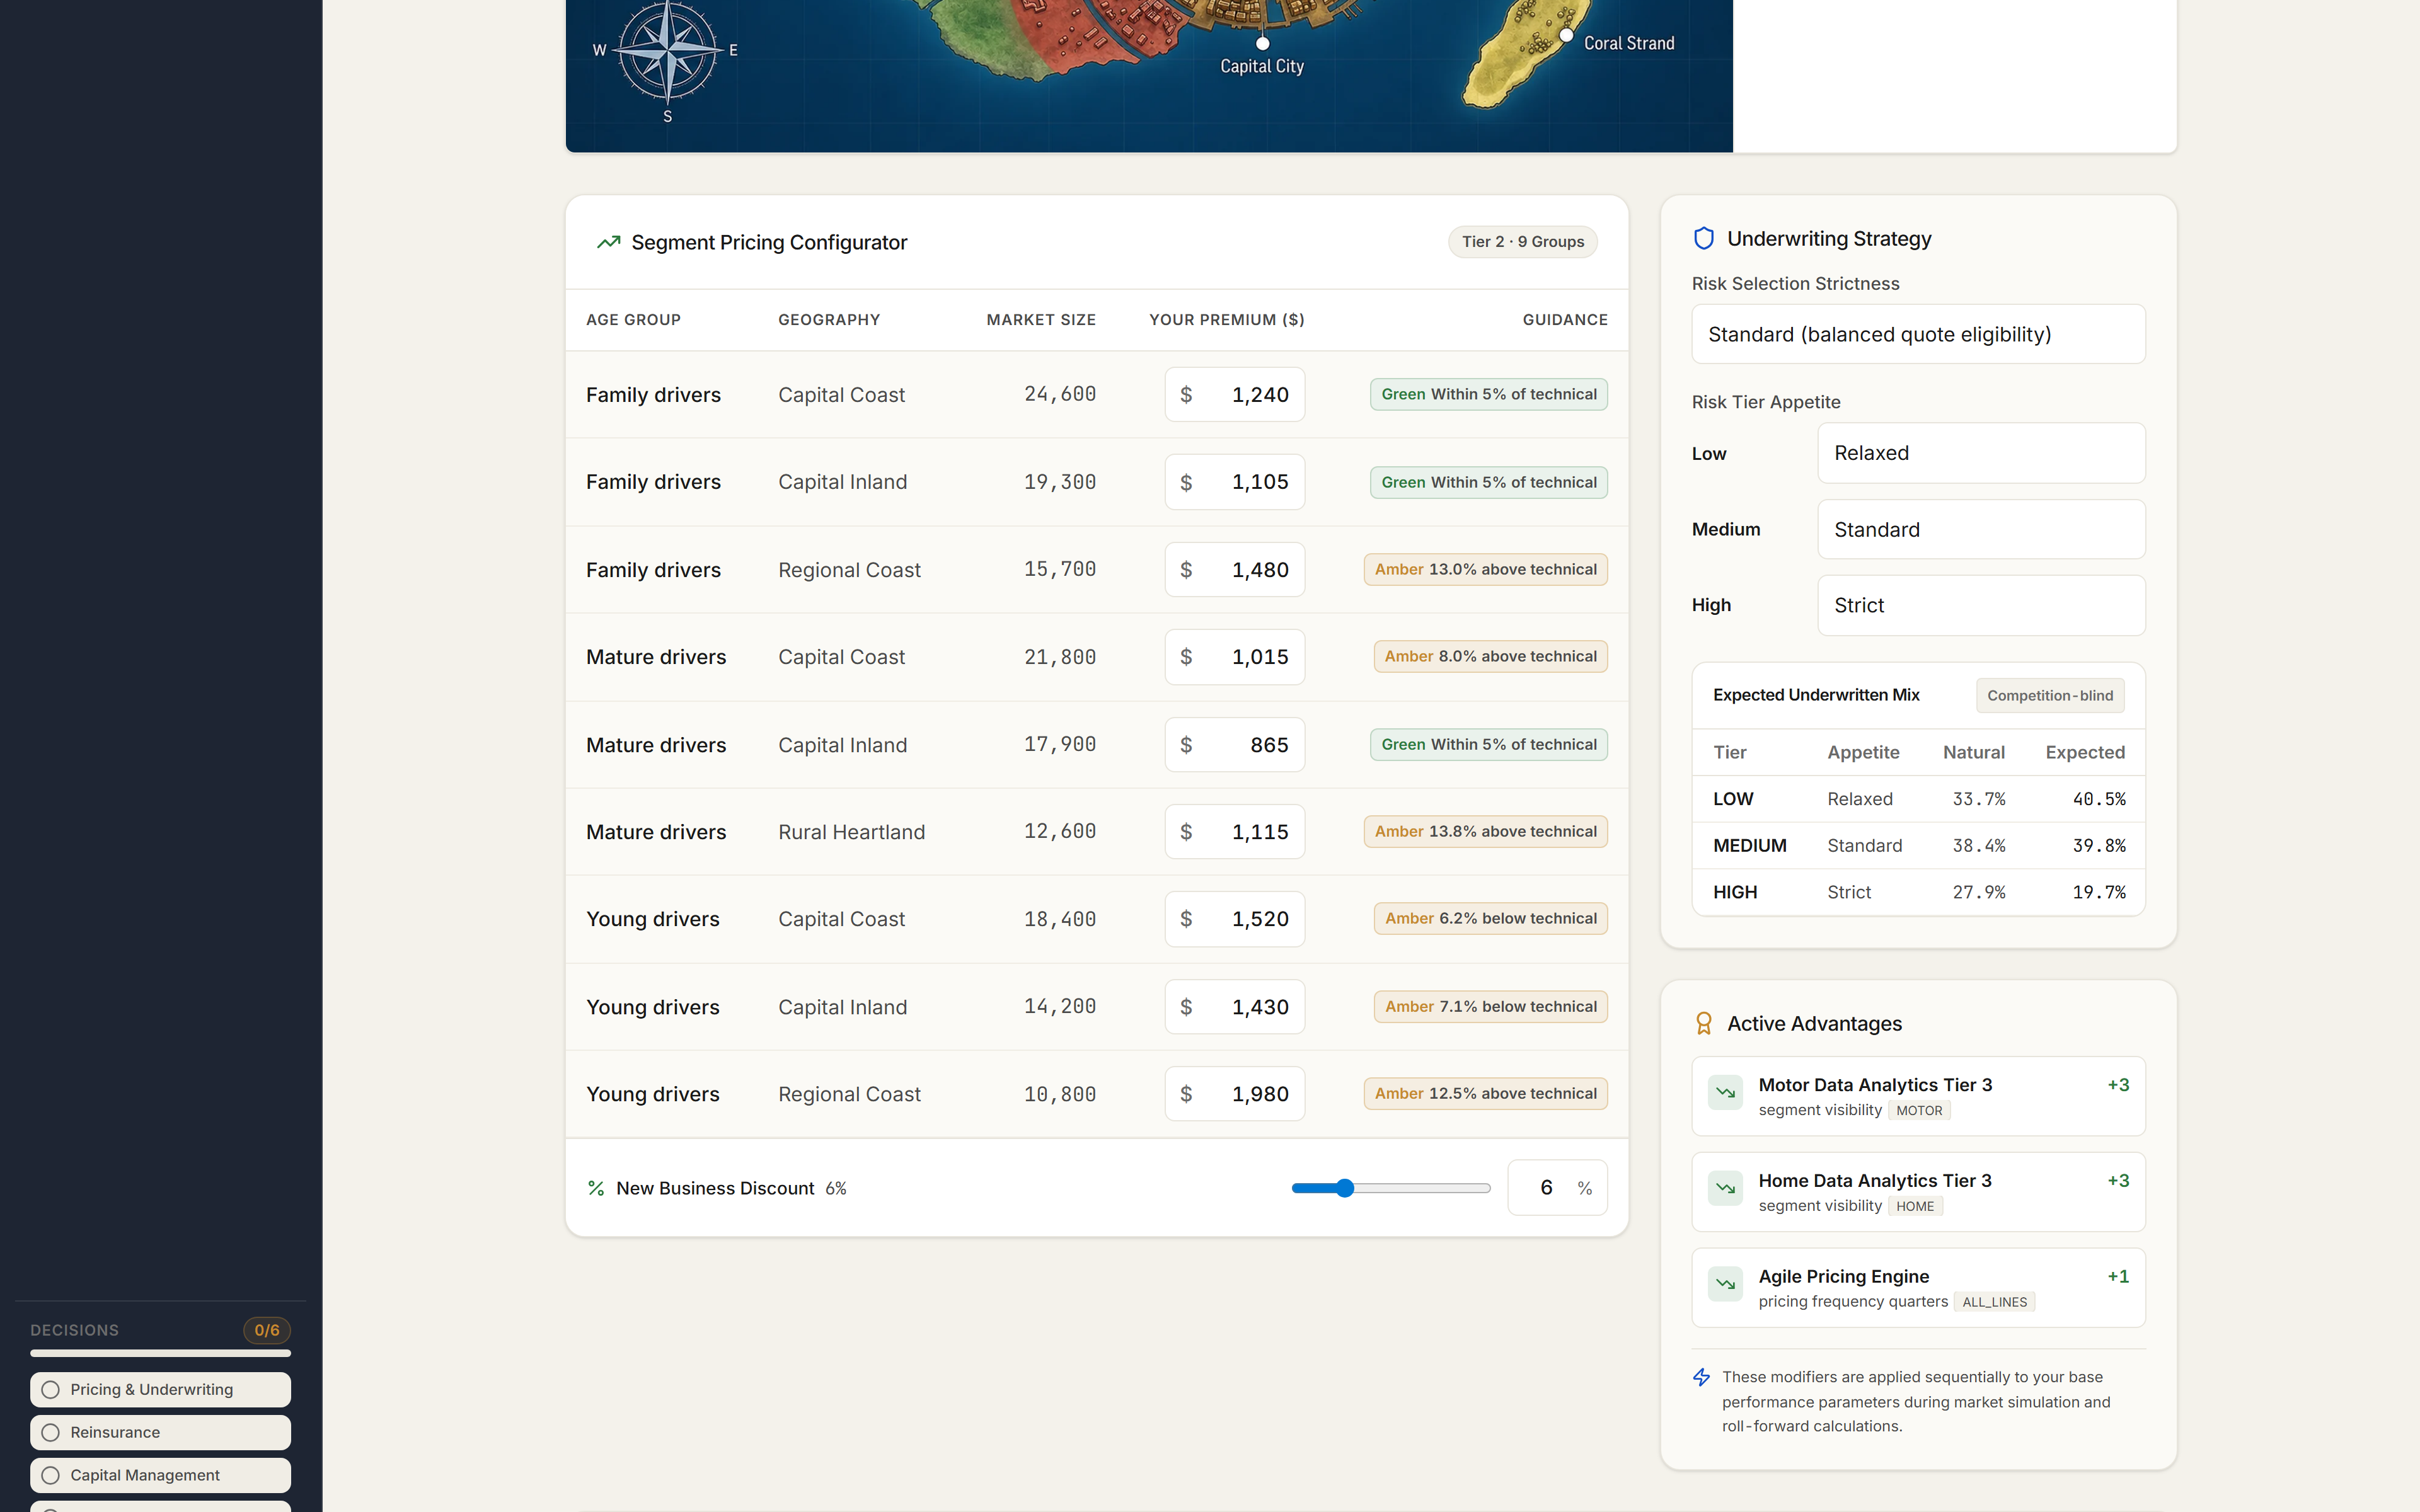
Pricing starts with the visible book. Teams set rates for the pricing groups their current data tier allows them to see, then decide how aggressively to discount newly won policies.
The consequence is not a single demand response. Price changes reshape volume, mix, GWP and loss ratio, including adverse-selection effects that only become clear after experience develops.
Portfolio Management
Underwriting
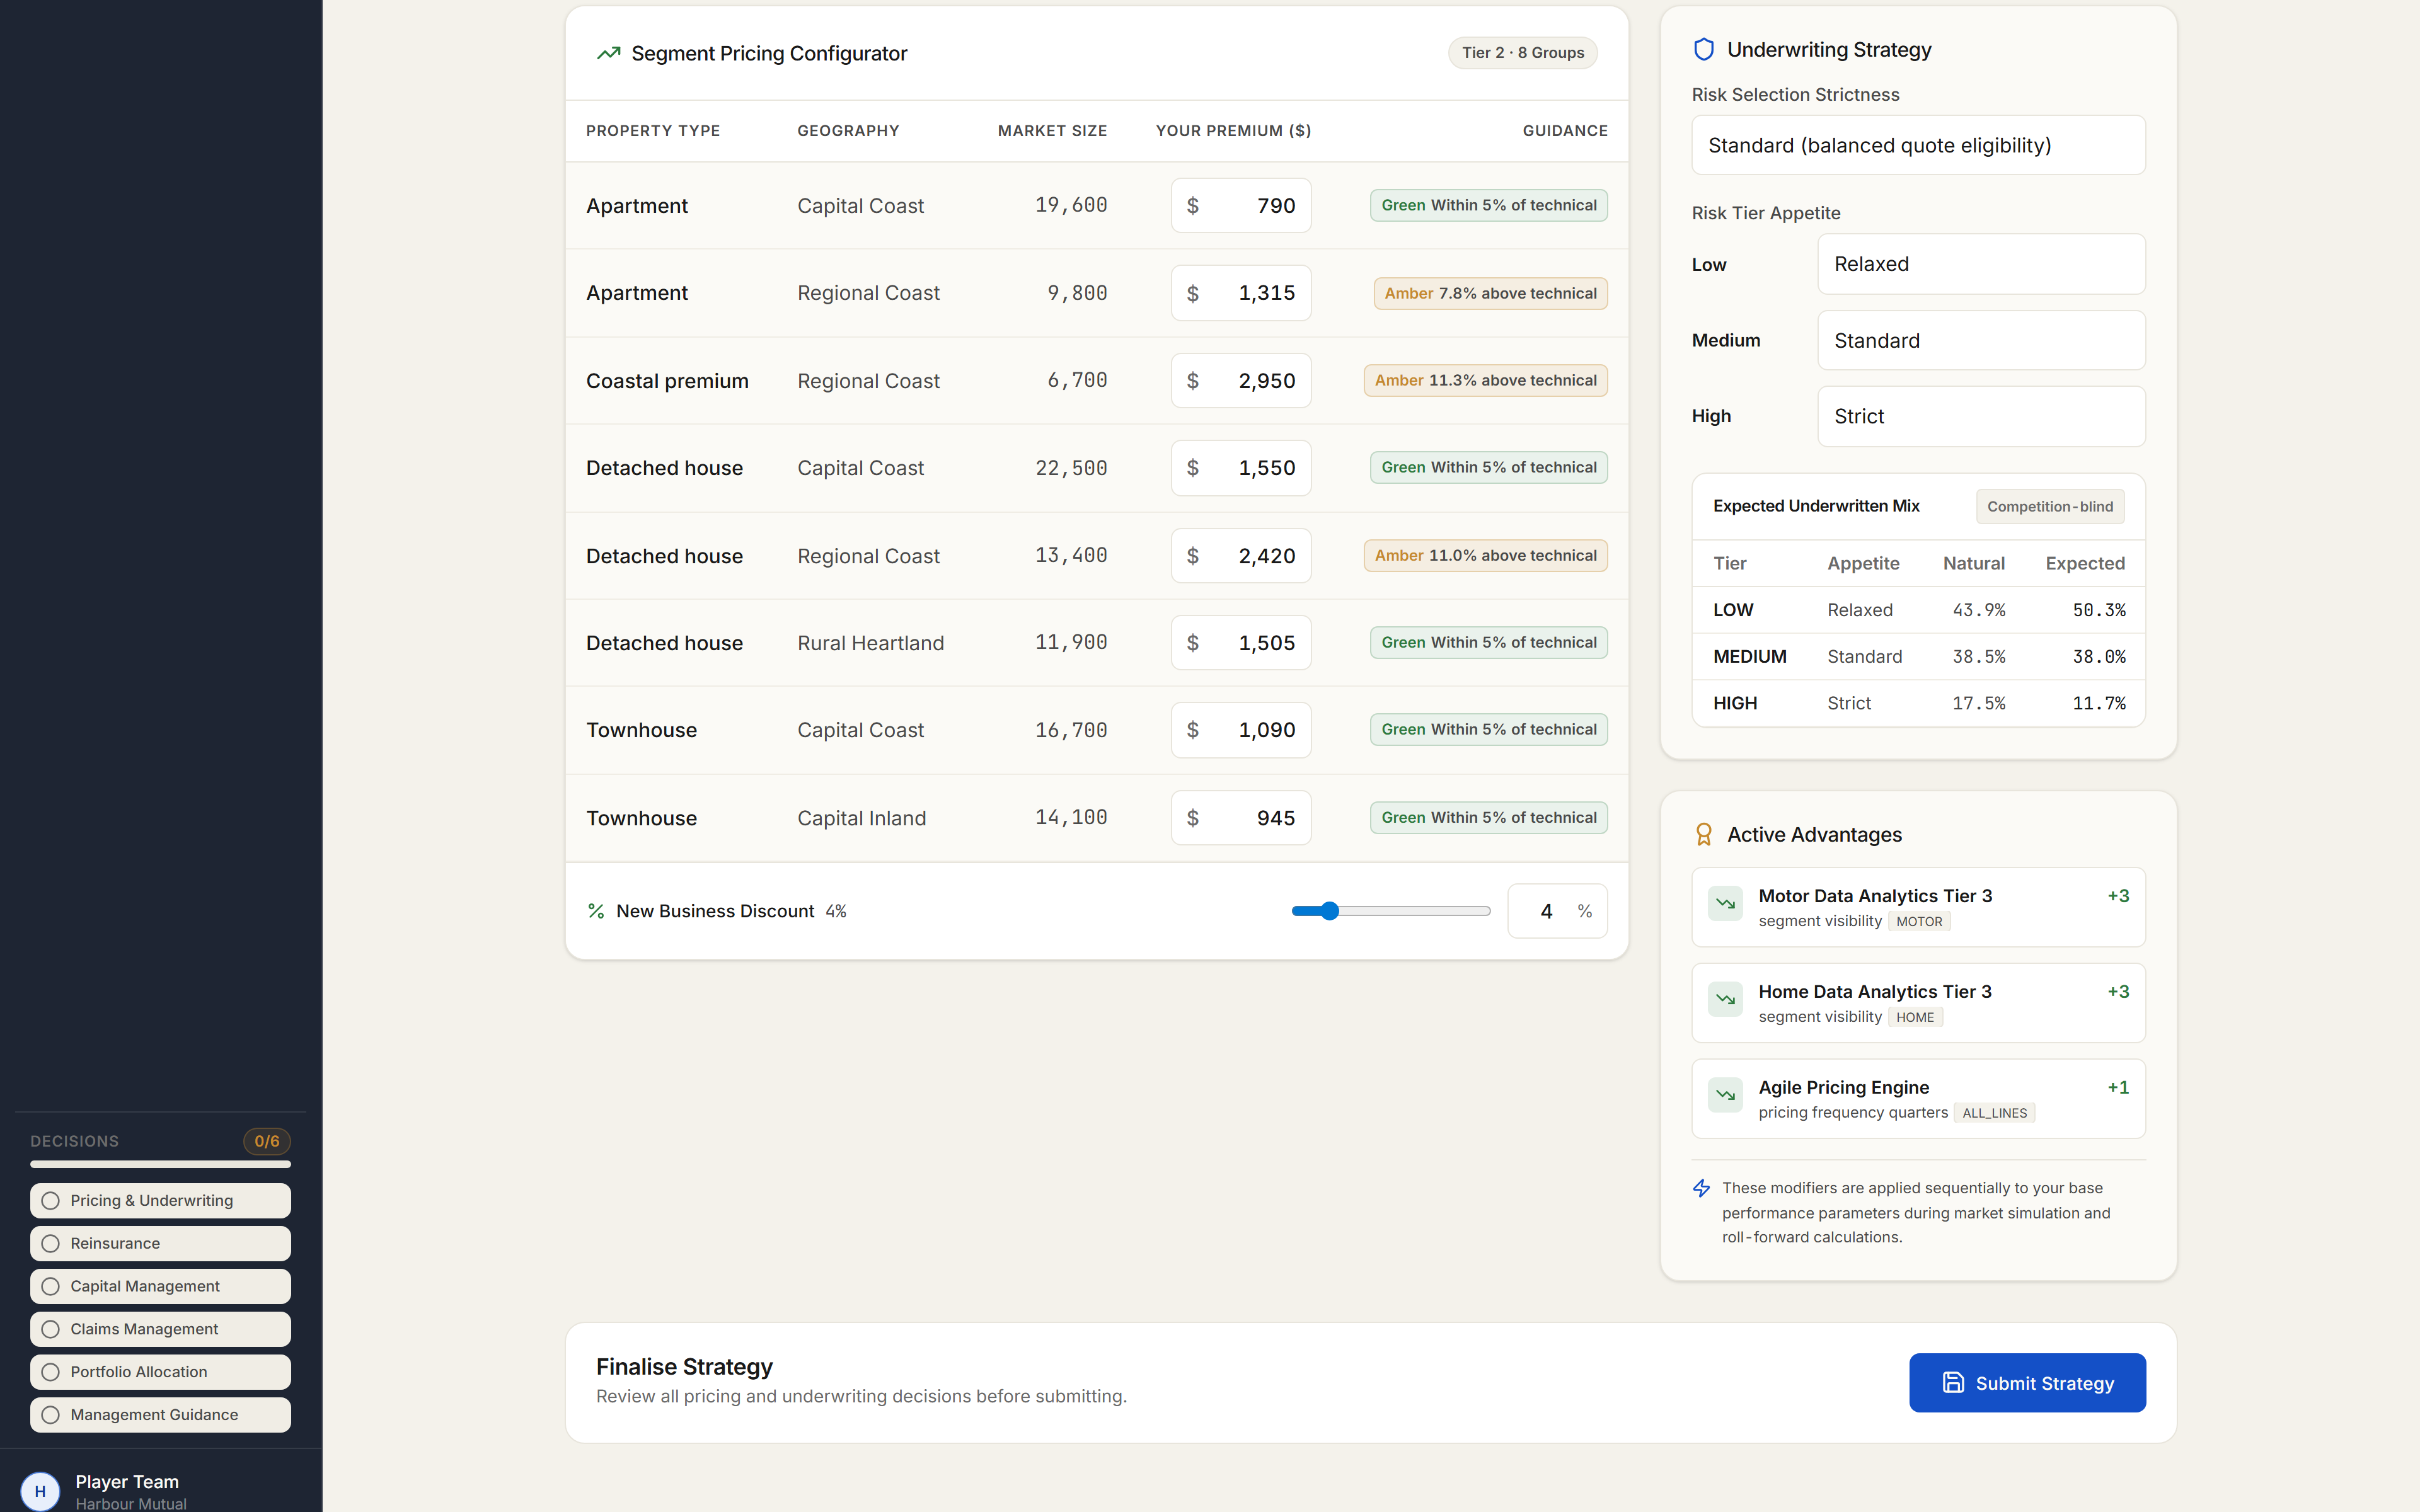
Underwriting controls which risks make it into the portfolio. Teams set quote strictness and appetite by risk tier, with better data revealing more of the shape of the book.
The effect arrives before the claim does. Eligibility and appetite change the exposure base, the expected mix and the loss experience the team will later have to explain.
Claims Management
Claims strategy
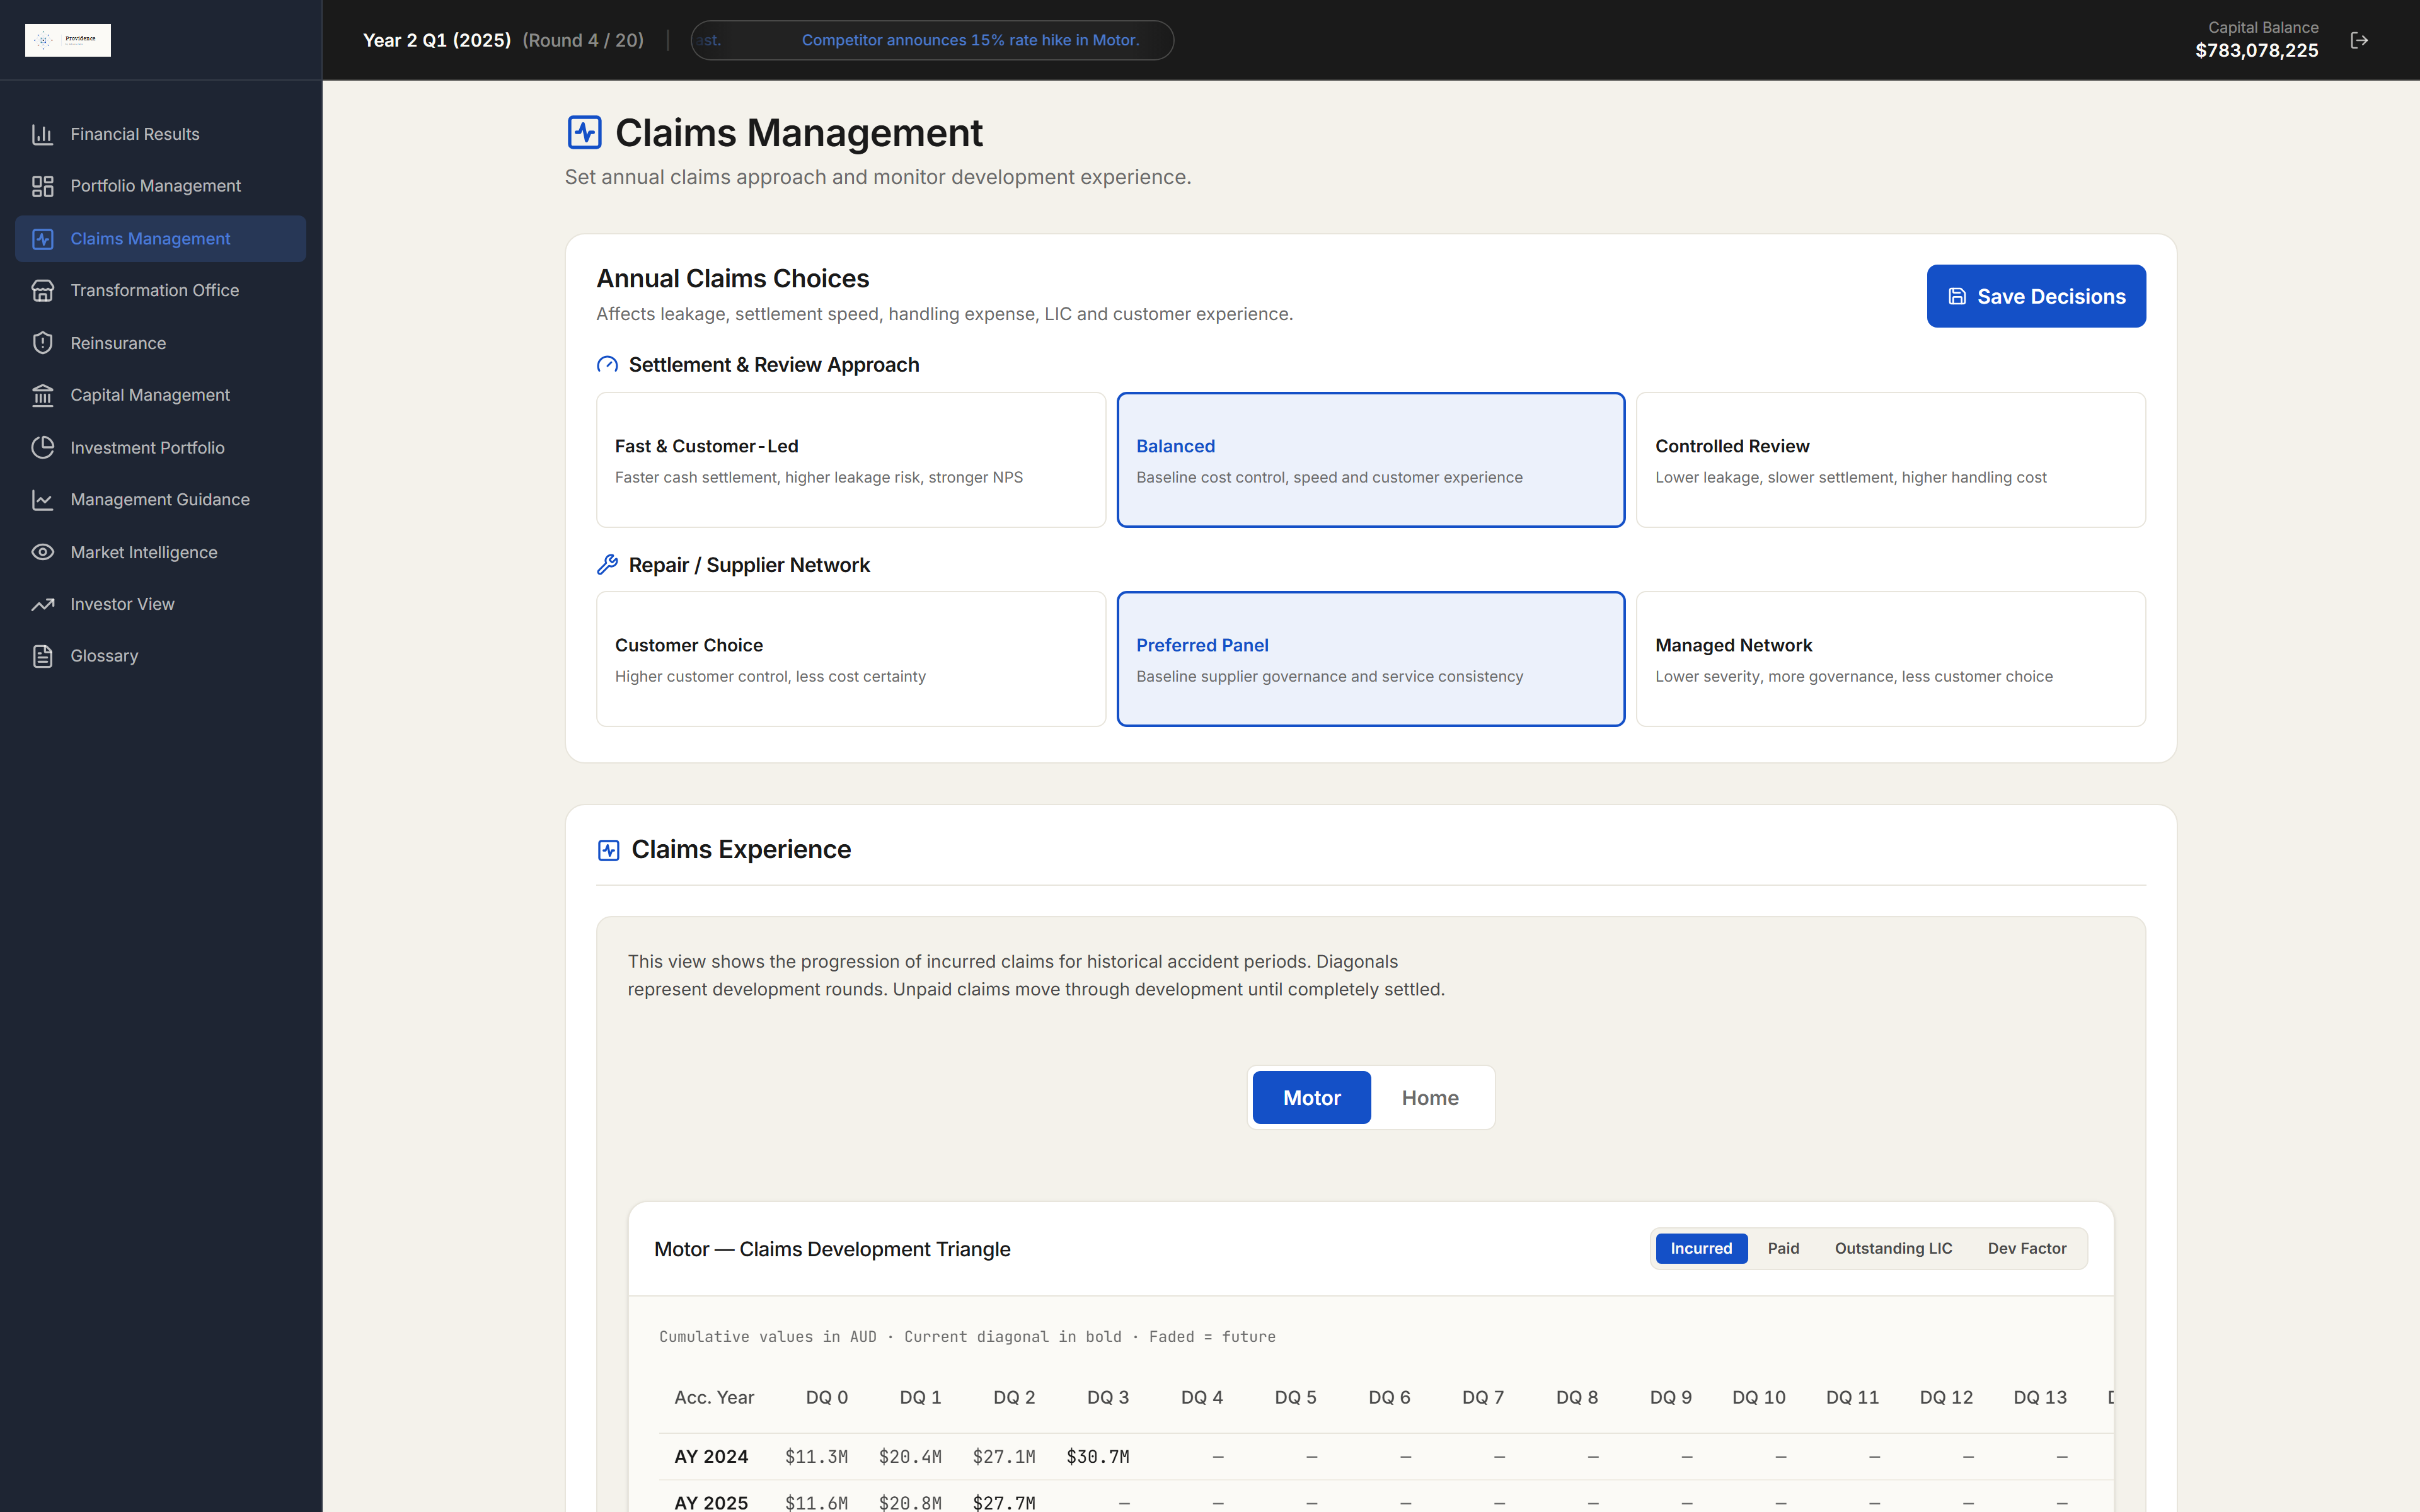
Claims is treated as an operating decision, not a background assumption. Teams choose how aggressively to settle, how closely to review and which repair-network model to run.
Those choices move more than paid claims. Leakage, severity, handling expense, payment timing, LIC and customer experience move together.
Transformation Office
Capability investment
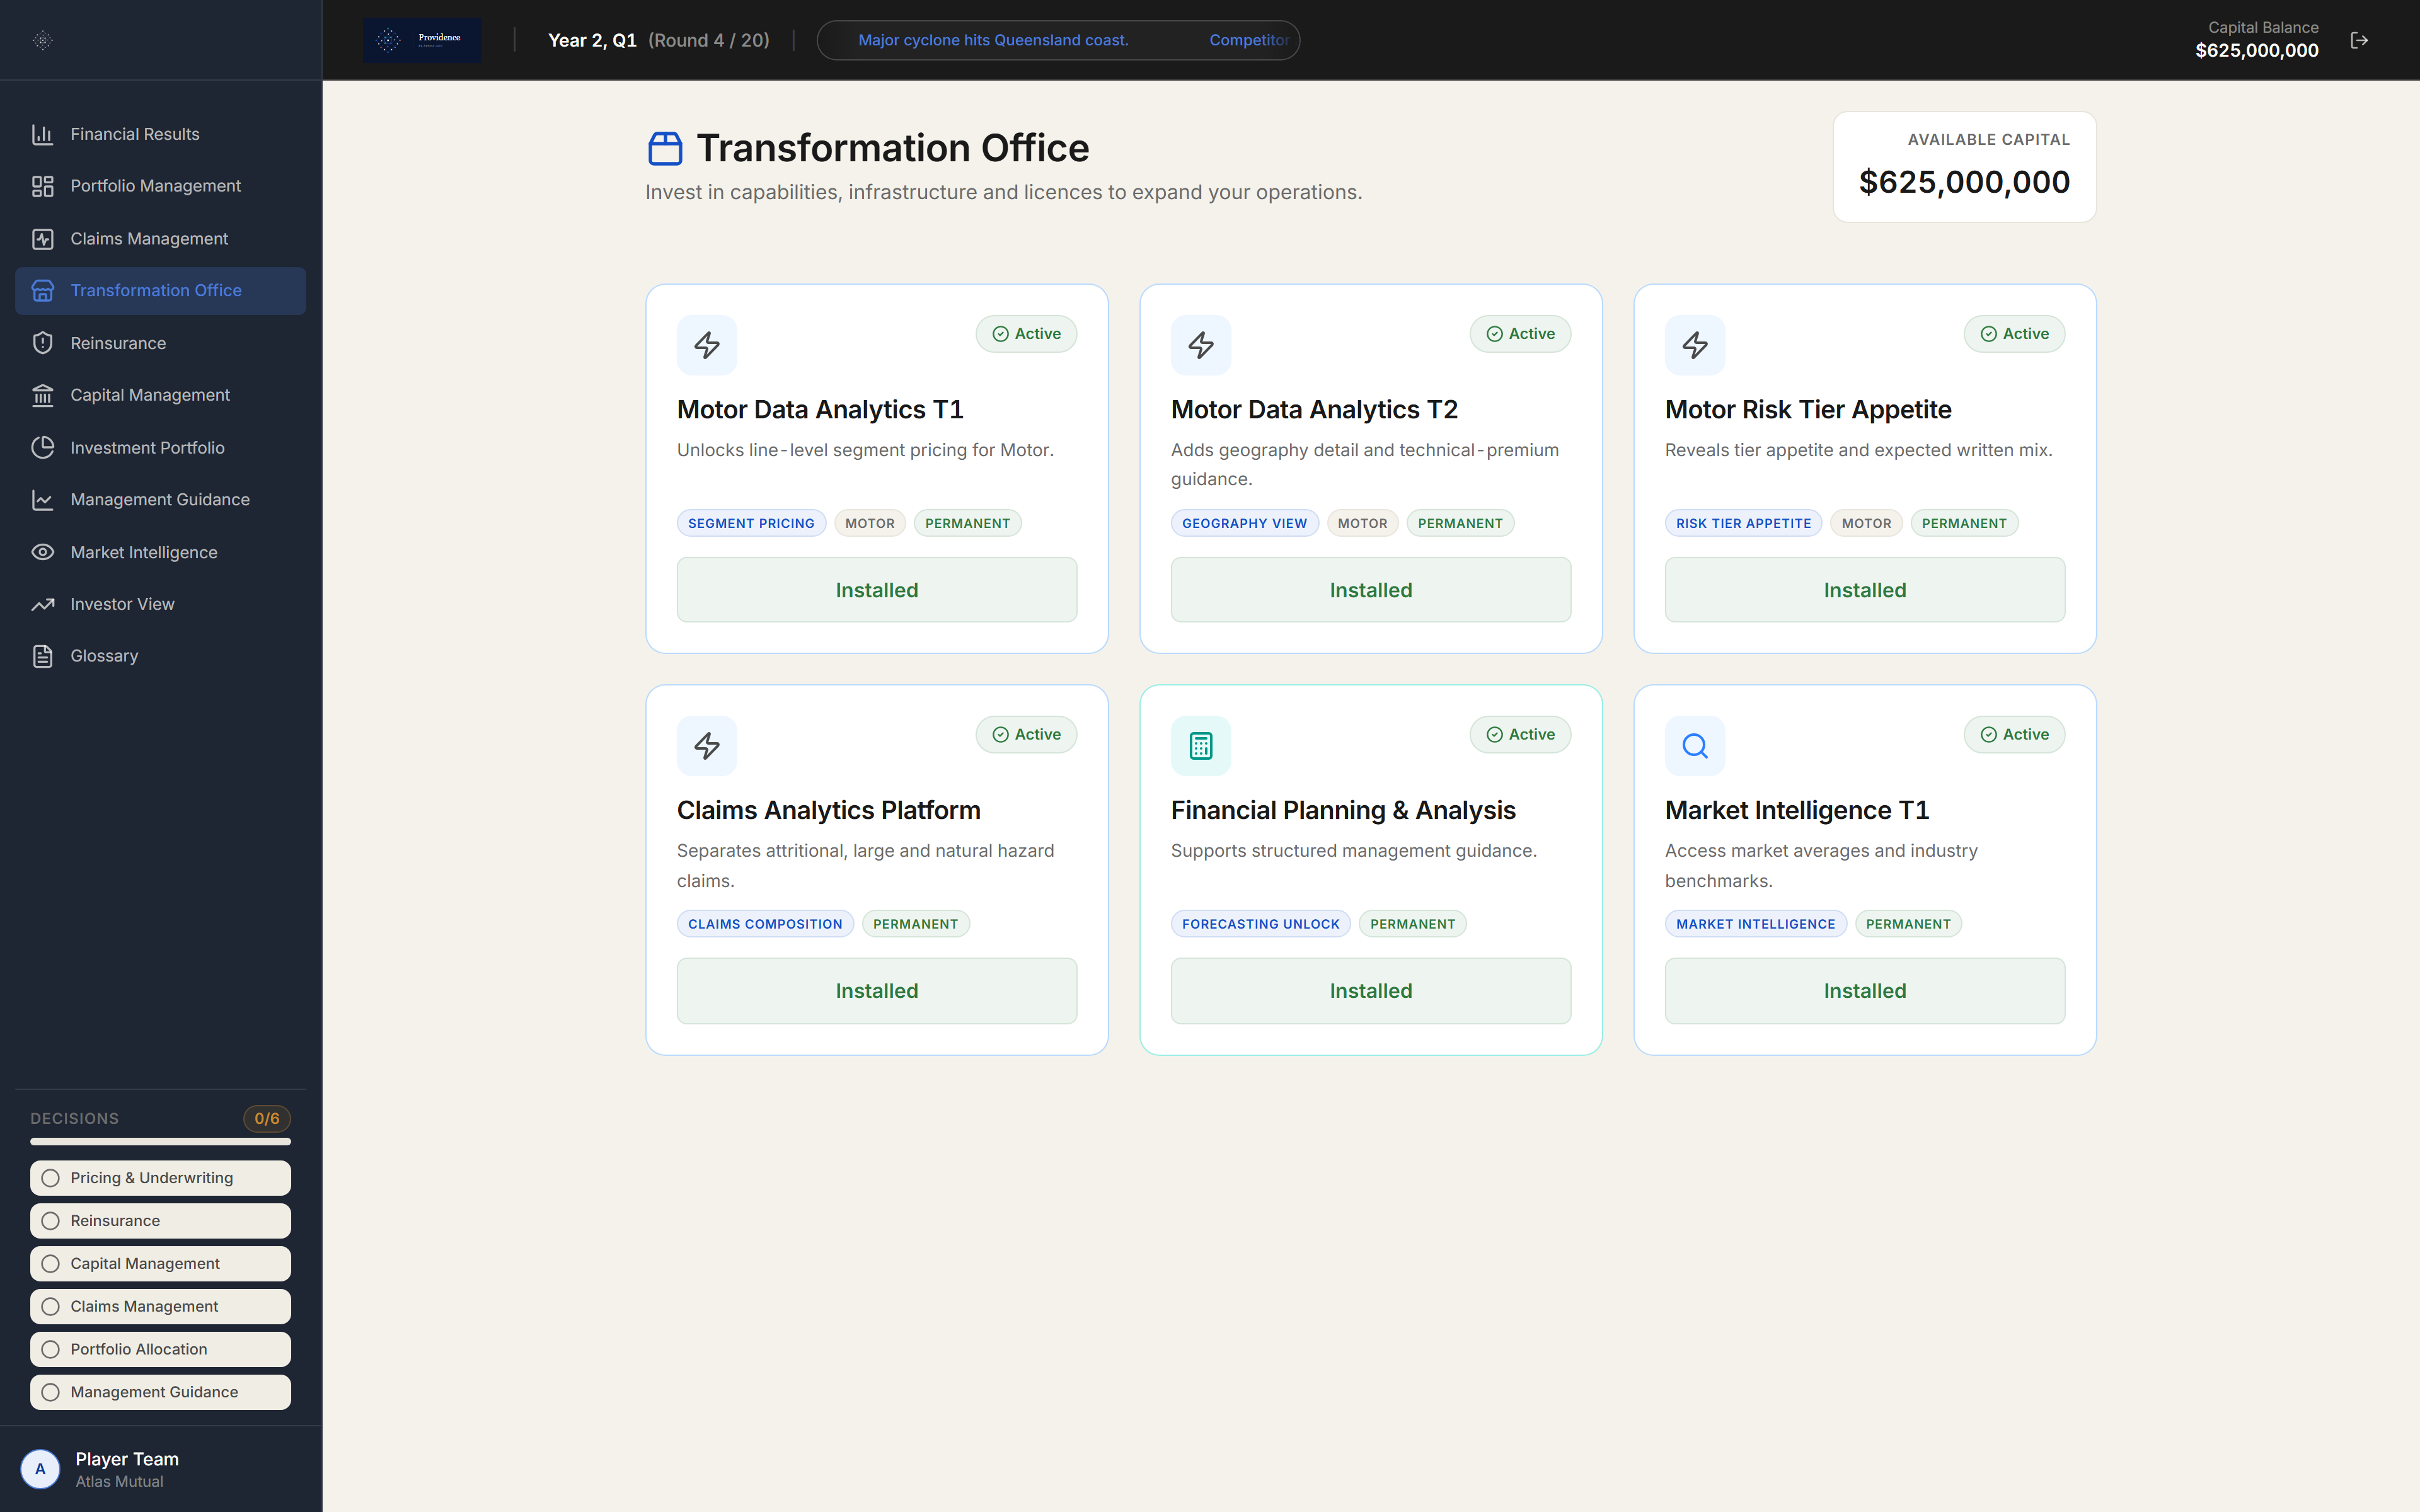
Transformation spend is finite. Teams choose which capabilities to fund, in what sequence and whether the payoff is worth the capital and timing trade-off.
The return is not just a higher score. Capabilities improve information, pricing cadence, claims control, fraud response and forecasting discipline in later rounds.
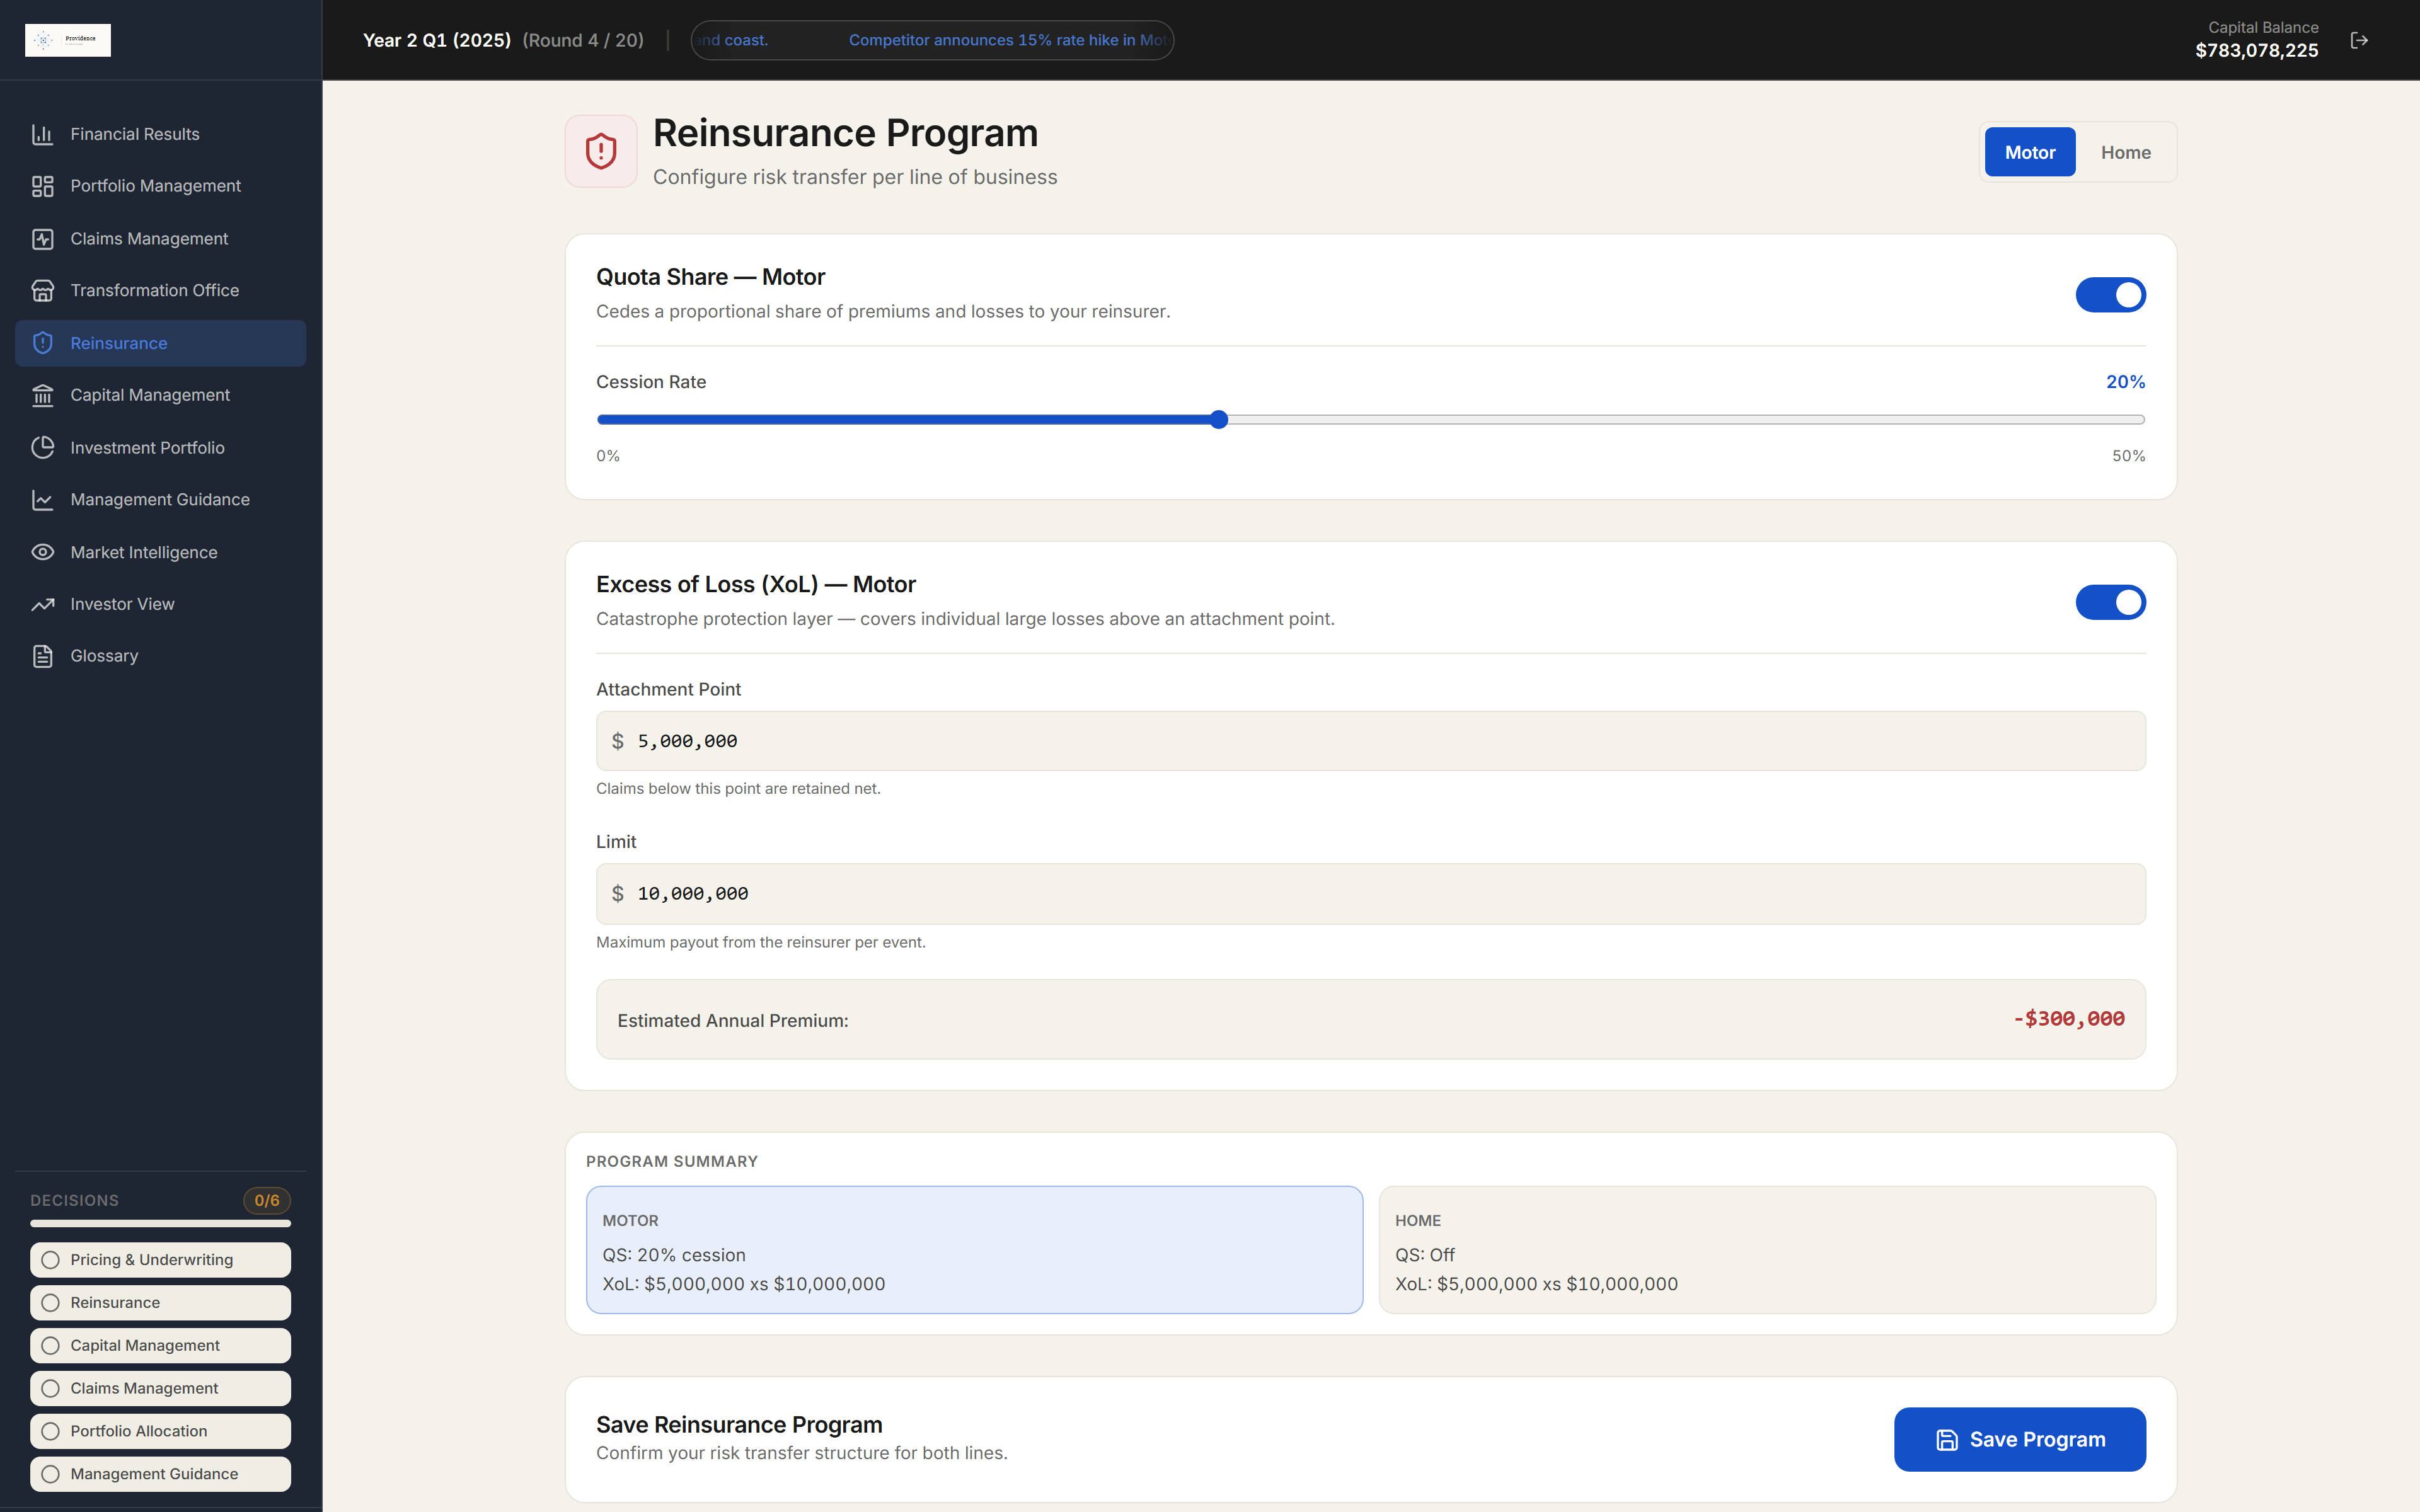
Reinsurance
Program design
Reinsurance asks teams how much volatility and capital strain they are willing to retain. Quota share and excess-of-loss settings are configured by line.
The trade-off is explicit: recurring margin is exchanged for recoveries, volatility protection and capital relief when the portfolio is stressed.
Capital Management
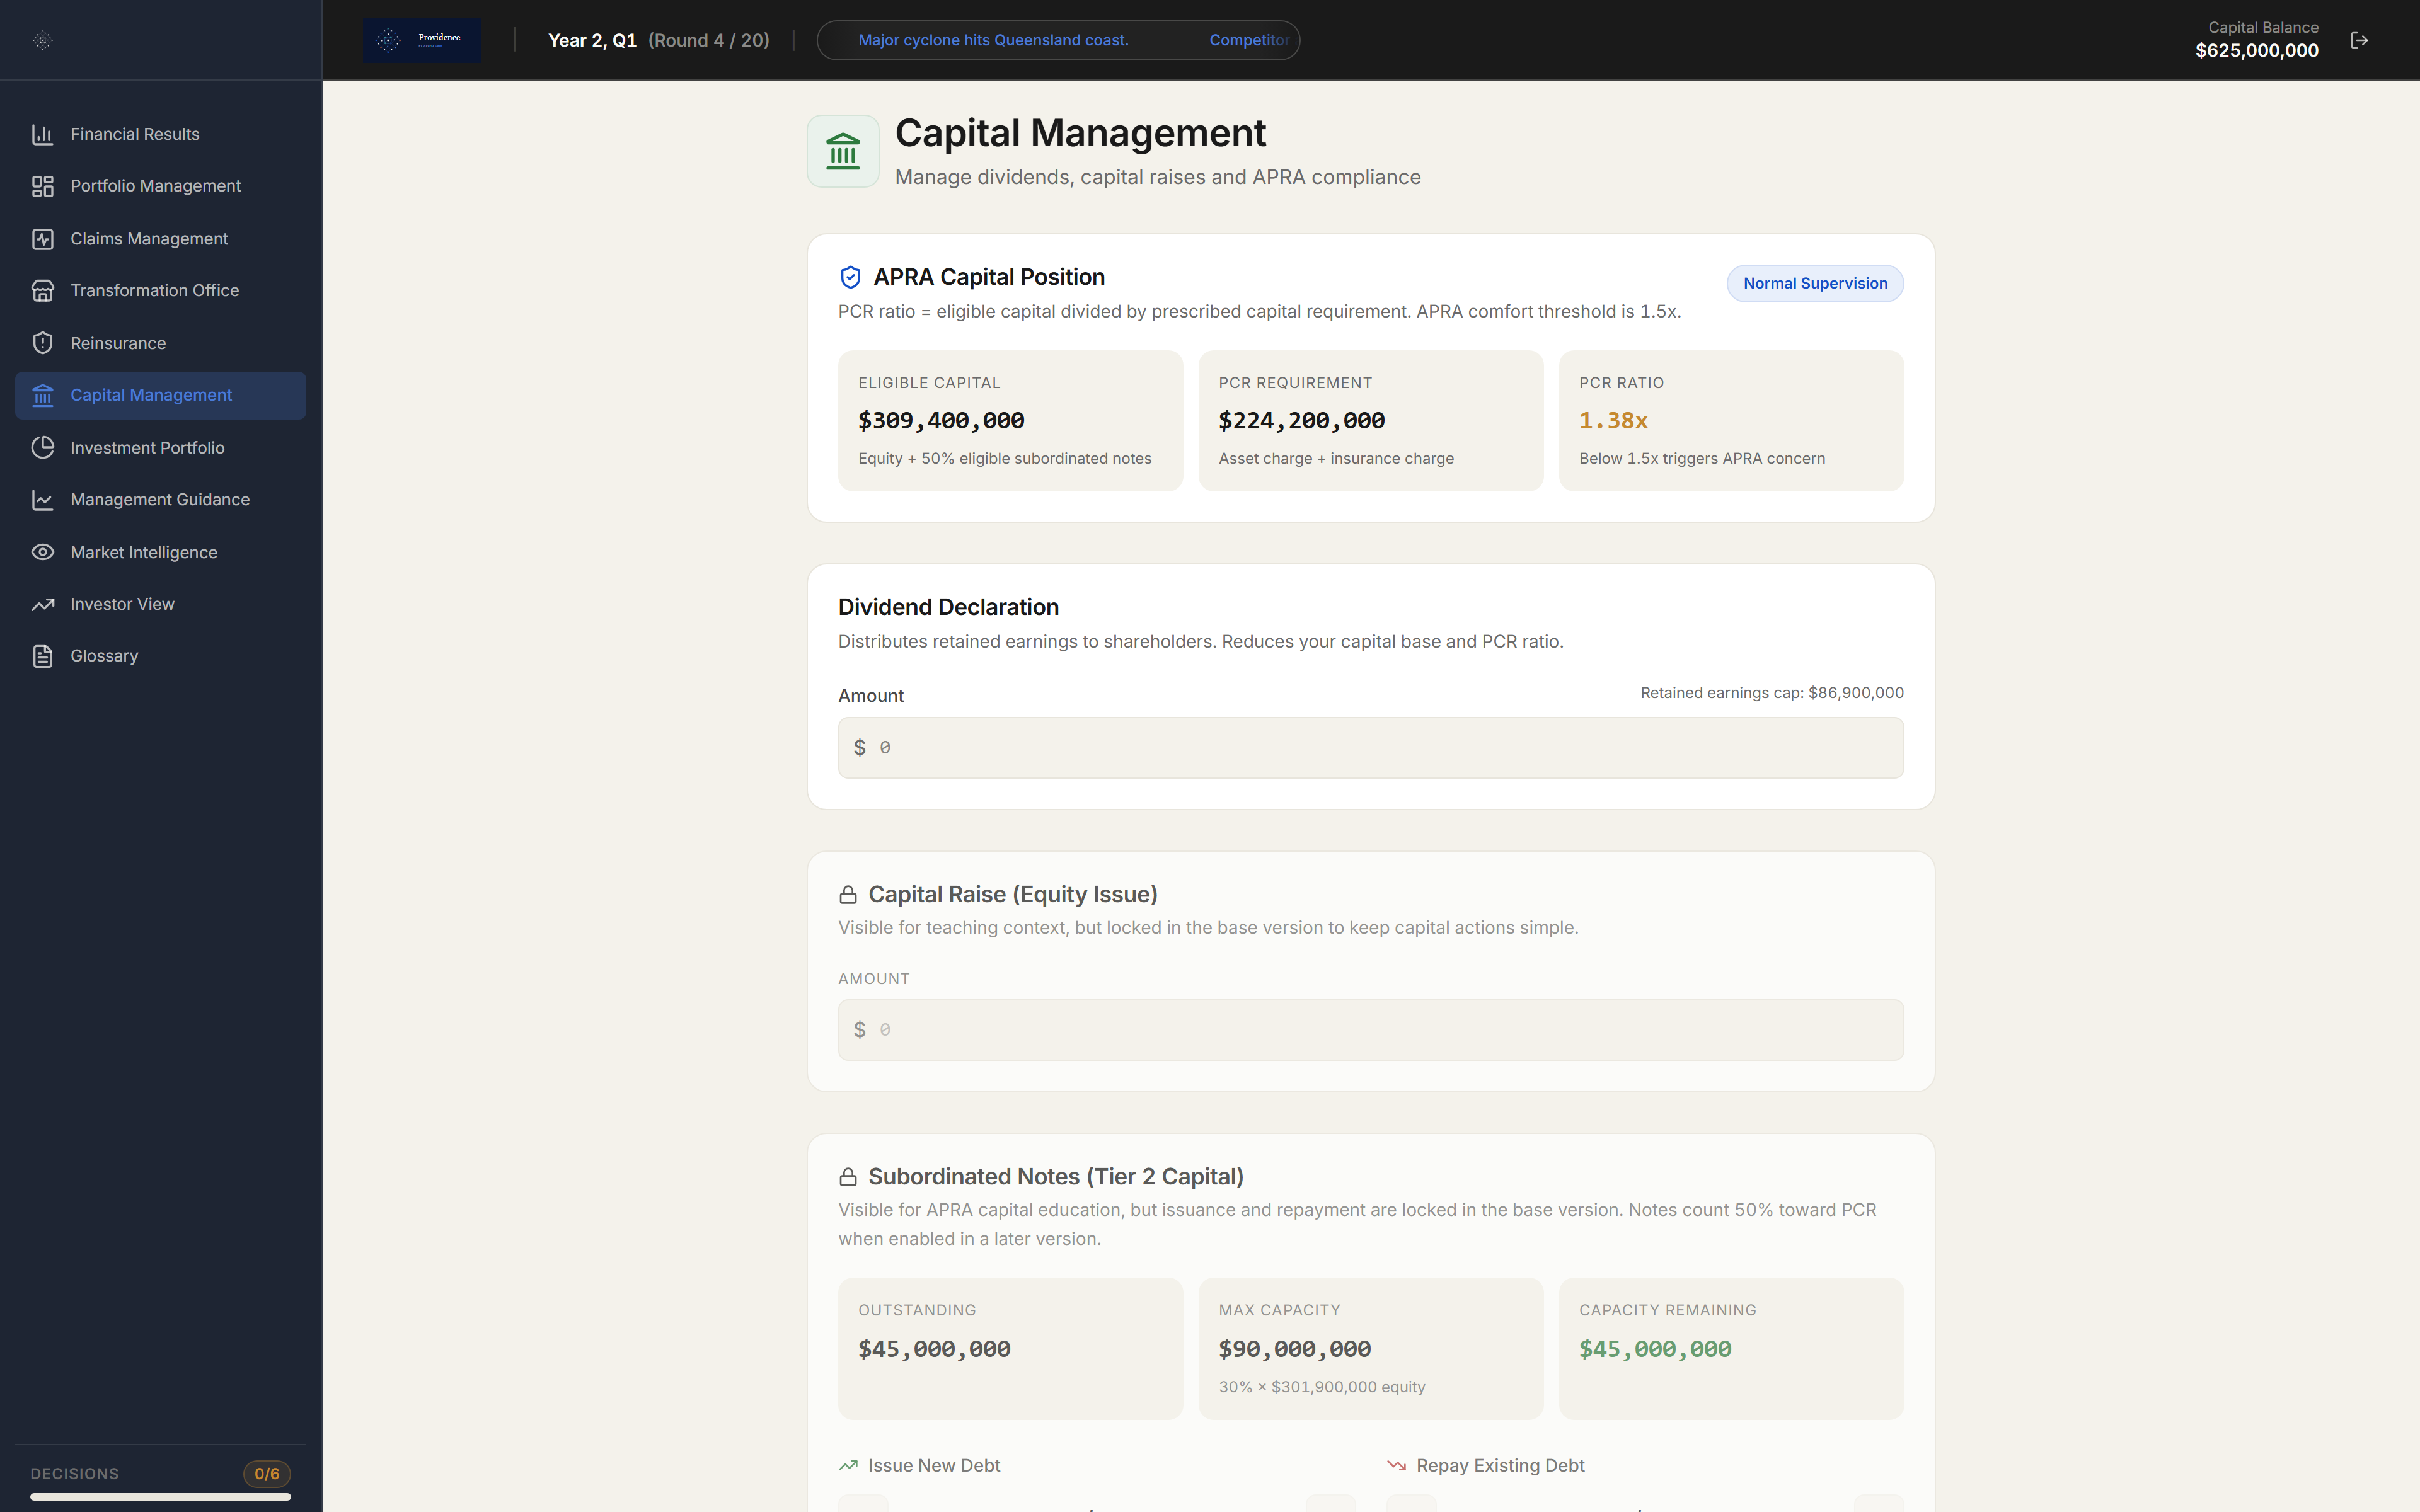
Distribution and adequacy
Capital management makes distribution a board-level decision. Teams set the dividend against the headroom left to absorb growth, volatility and adverse experience.
The trade-off is immediate: distribution reduces resilience, thin headroom constrains growth and capital pressure can force a change in the whole operating approach.
Investment Portfolio
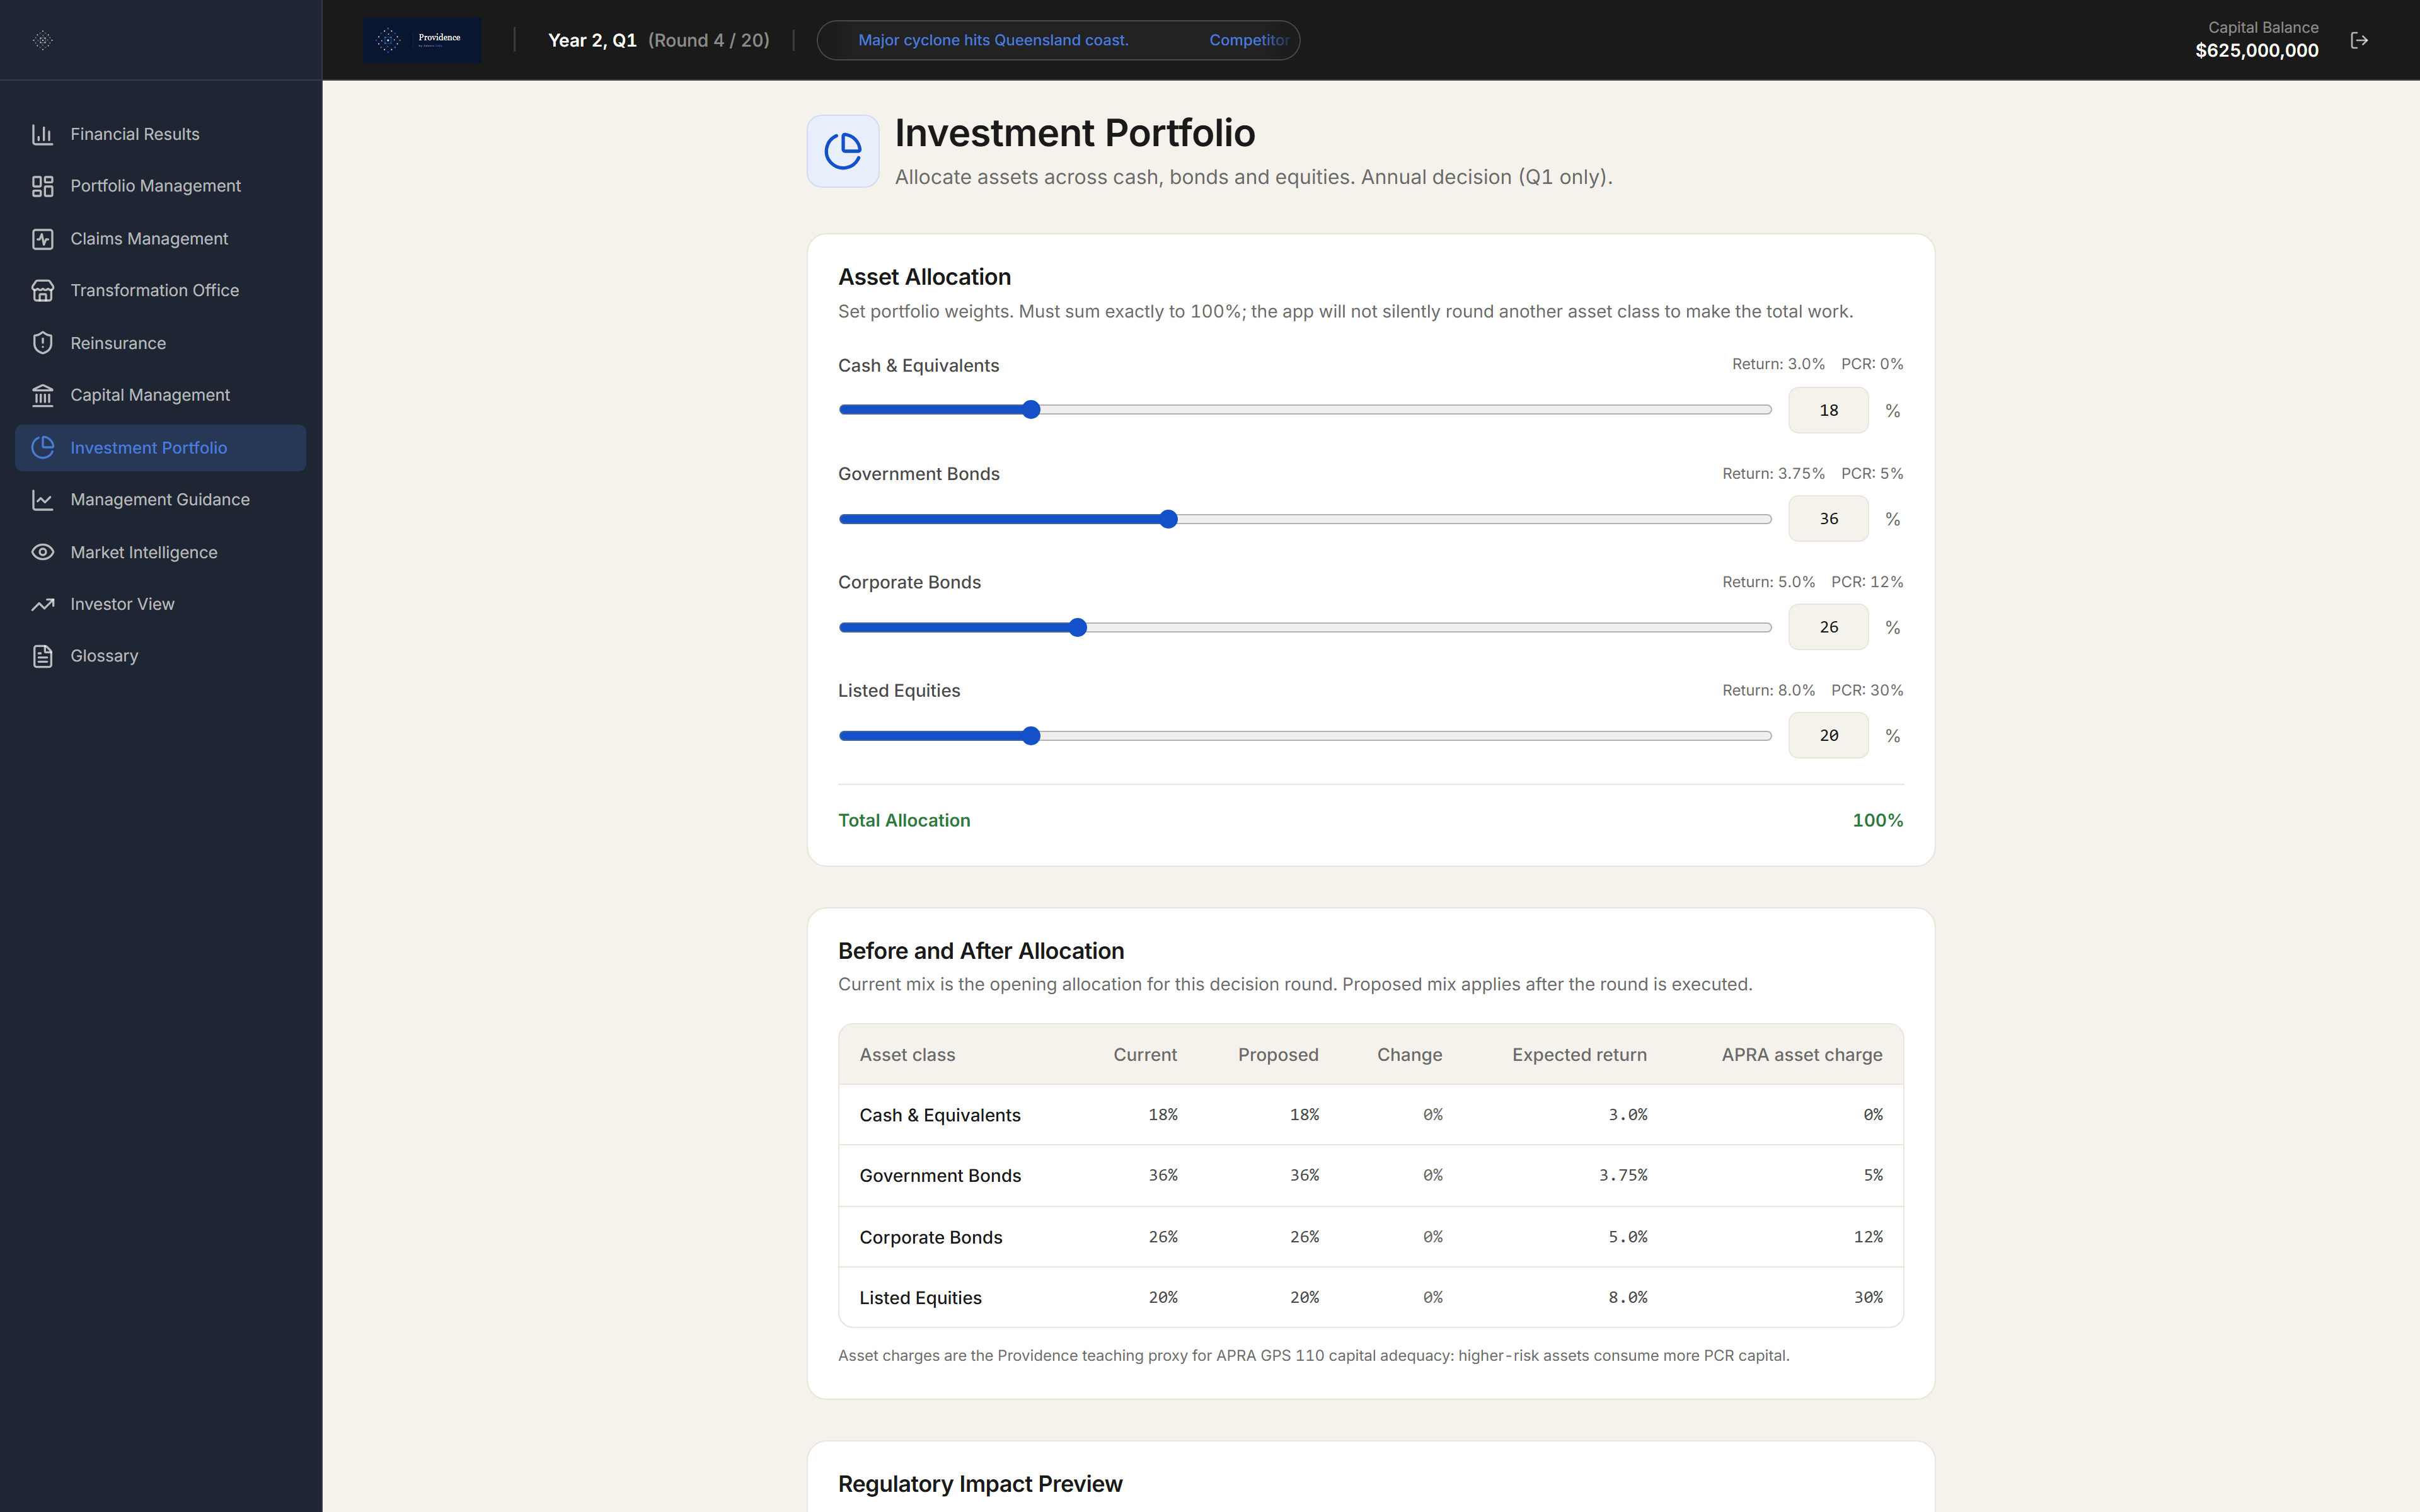
Asset allocation
The investment portfolio makes the asset-side trade-off visible. Teams allocate between cash, government bonds, corporate bonds and equities.
Returns flow through profit, but liquidity and capital charges shape how much resilience the insurer keeps when underwriting and claims outcomes move against it.
Management Guidance
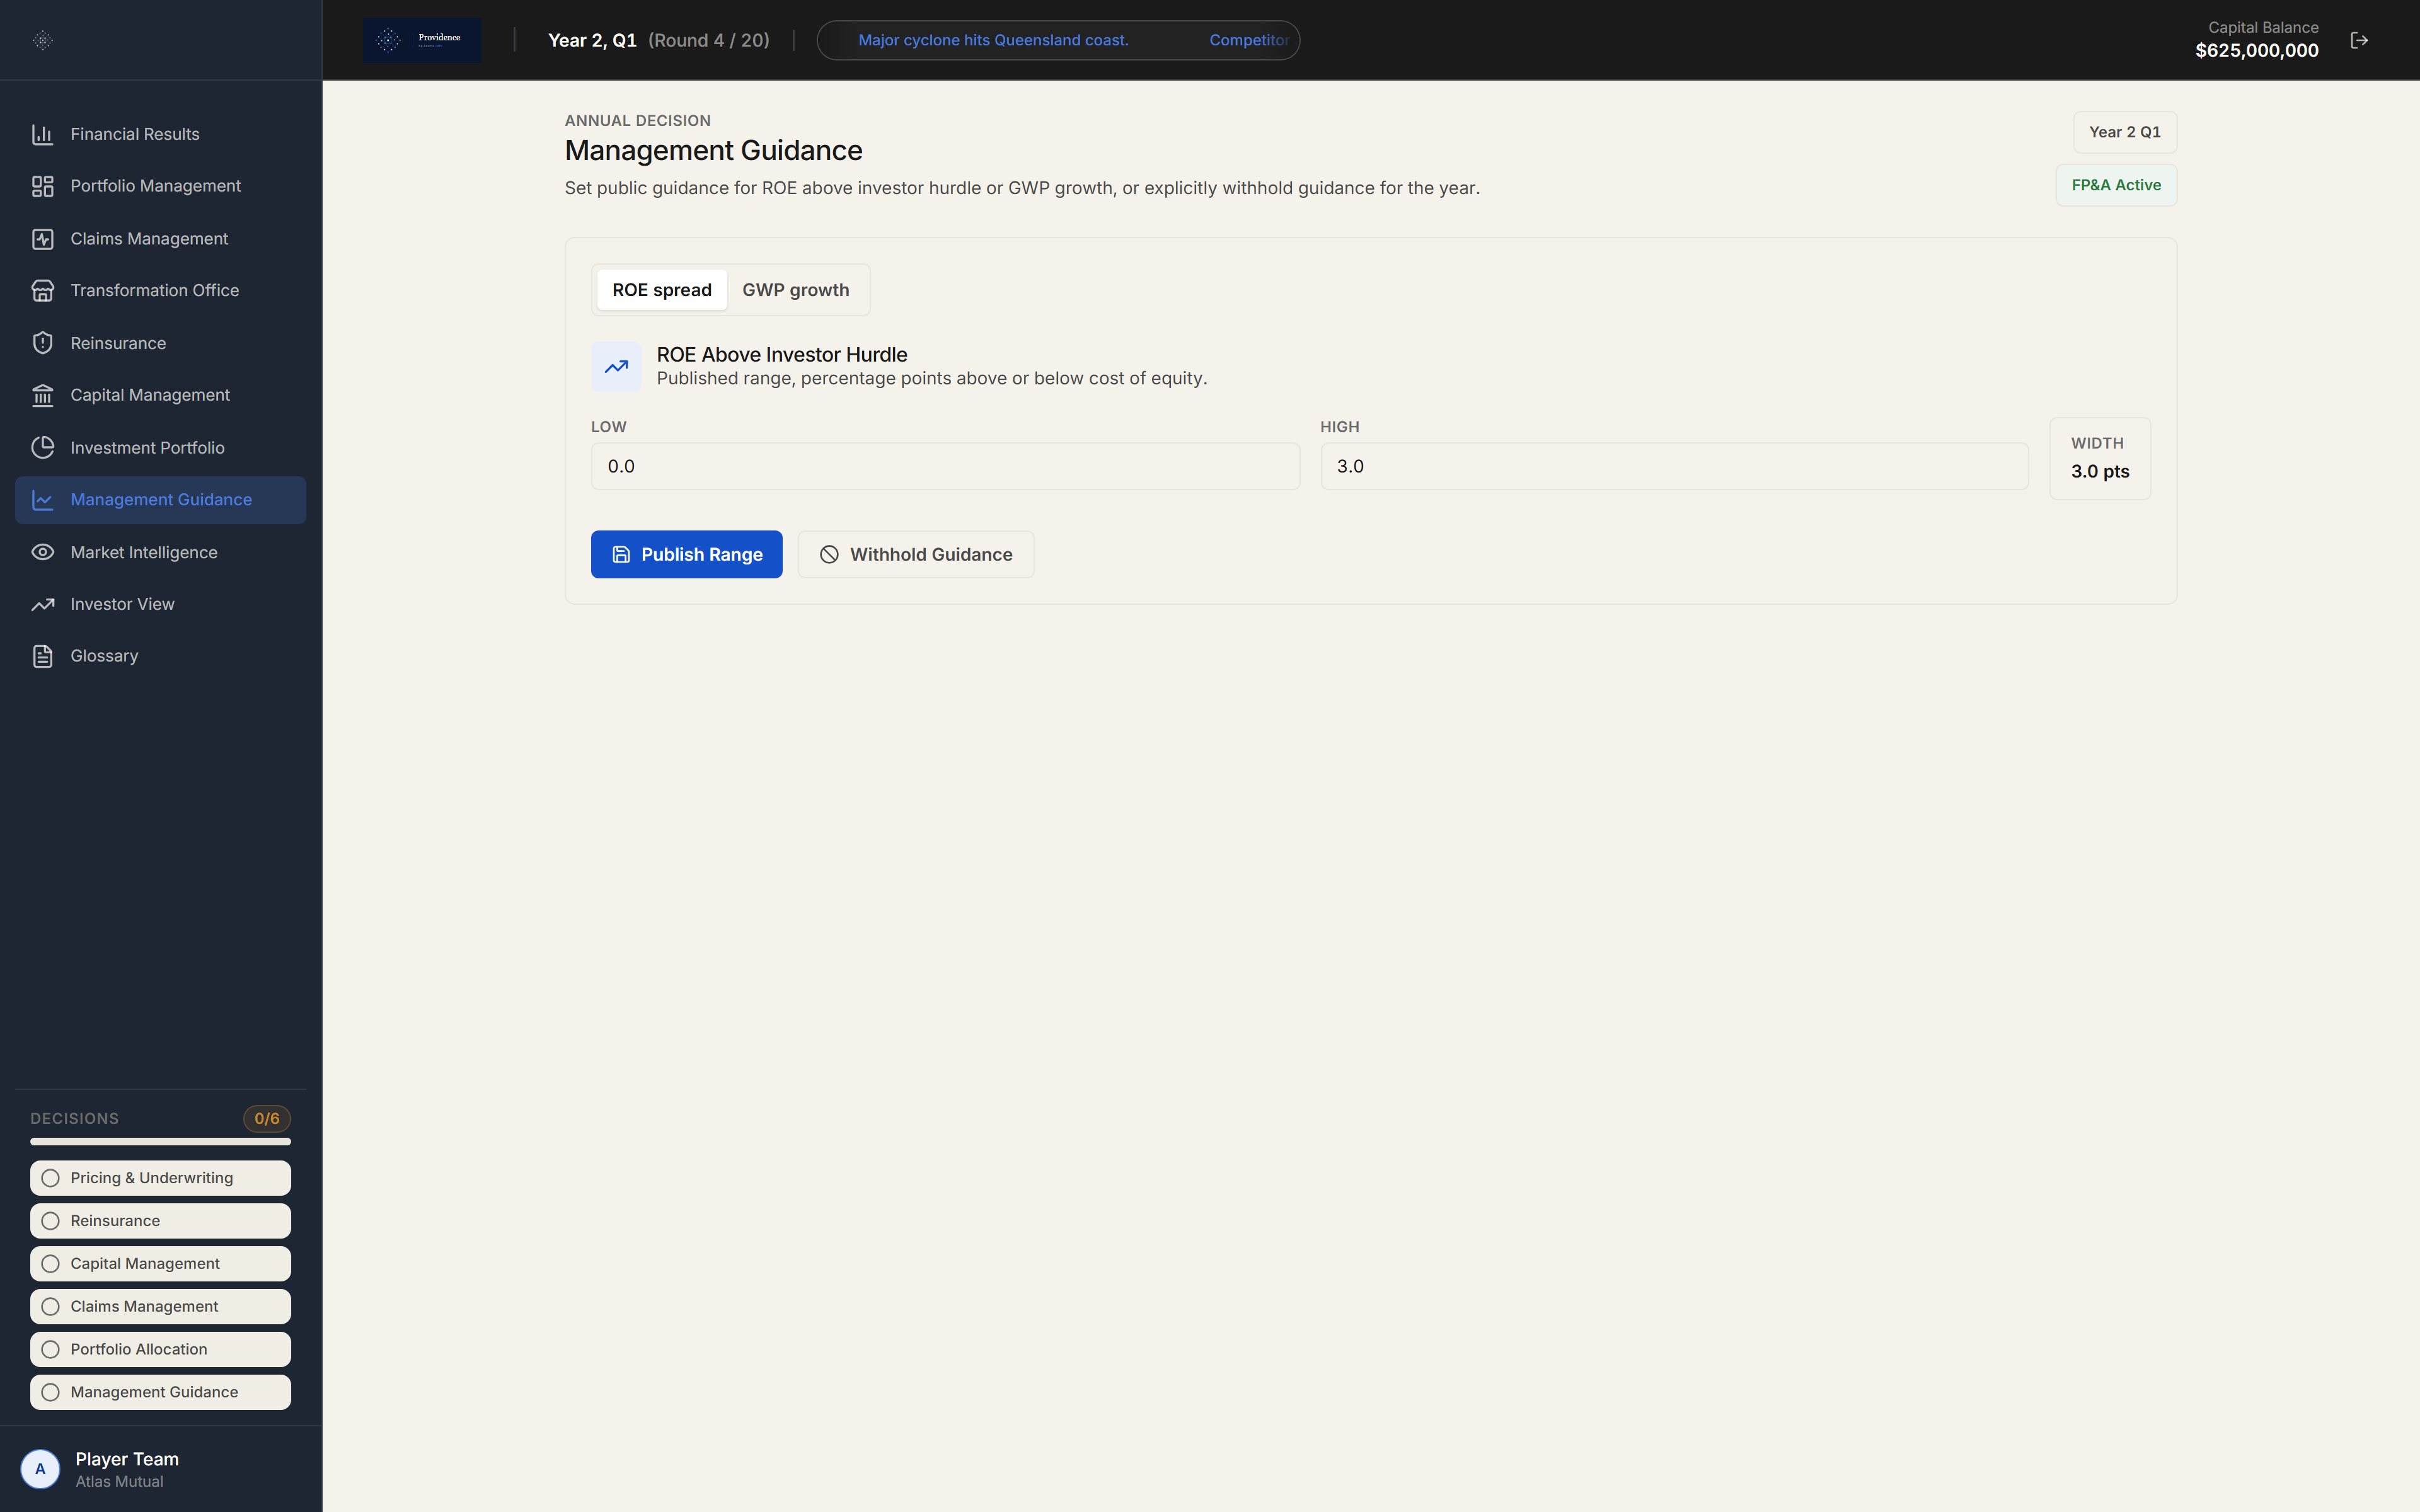
Public commitment
Management guidance turns the operating plan into a public commitment. Teams decide whether to guide the market and what range they are prepared to stand behind.
The Investor View later tests that promise against actual performance, making credibility part of the simulation rather than a line of commentary.
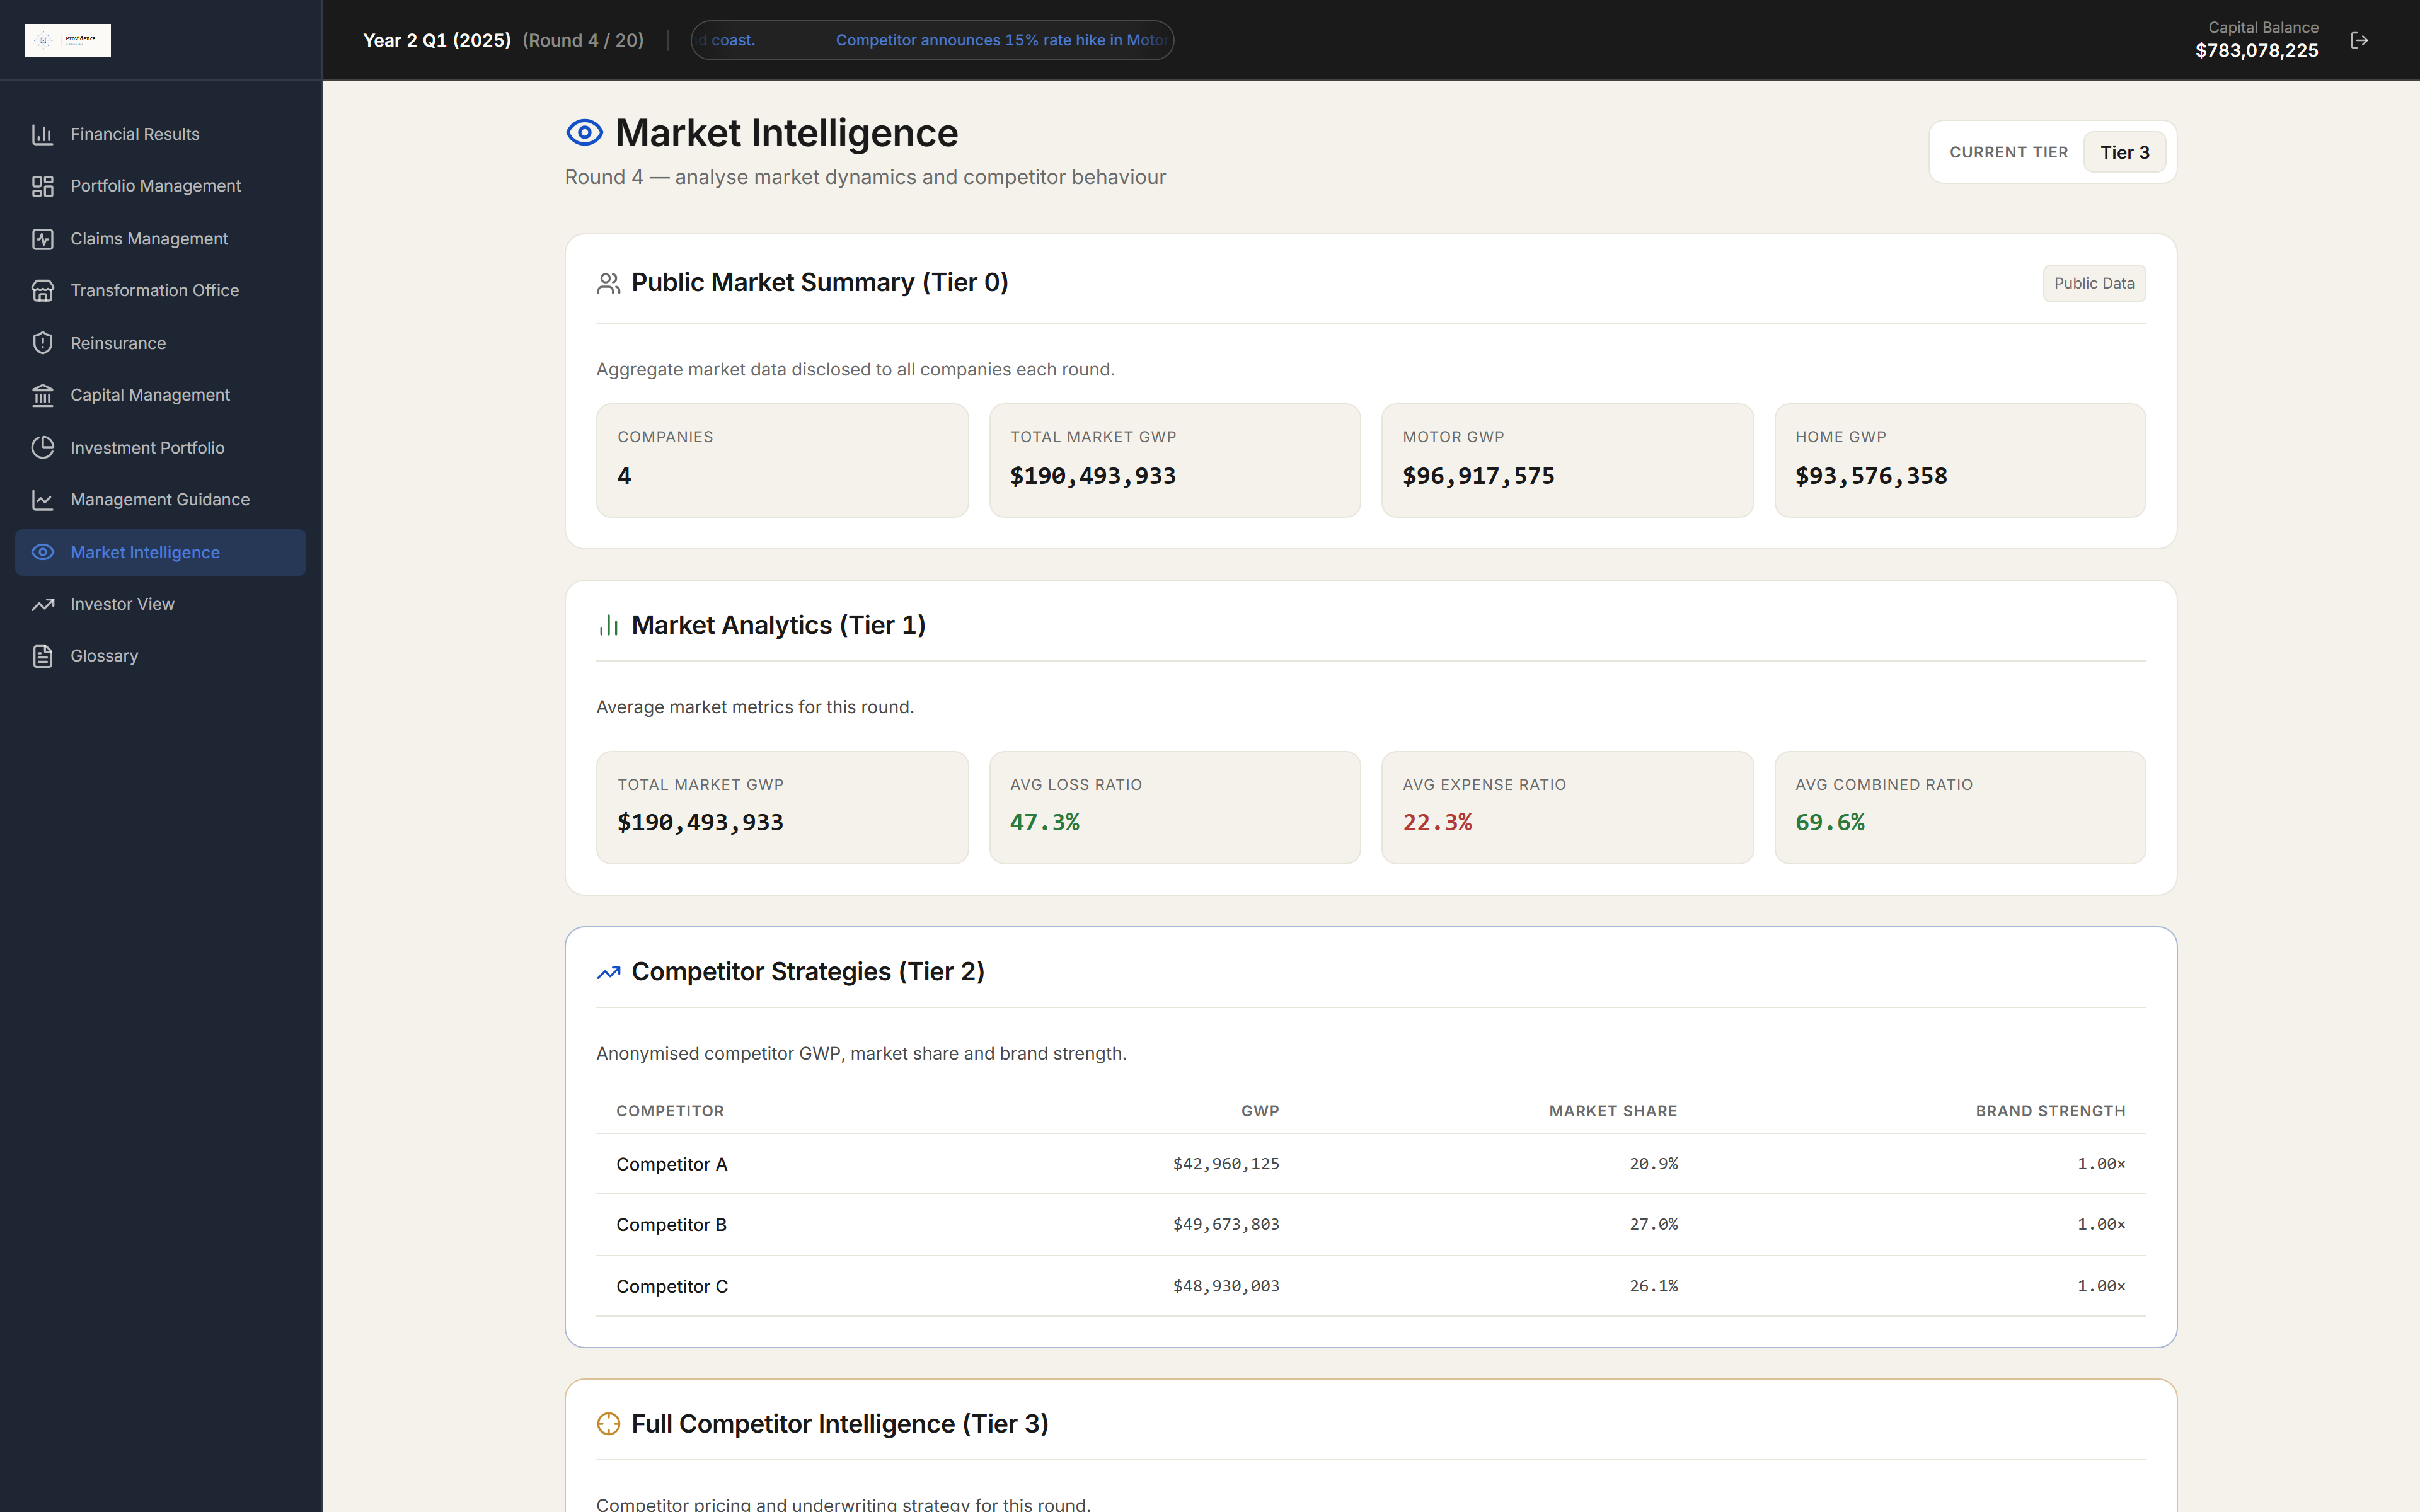
Market Intelligence
Evidence and competitor readout
Market intelligence is deliberately not free. Teams choose whether better evidence is worth the investment cost and how much competitor detail they need before acting.
Better information does not make the decision for them. It changes how precisely they can diagnose the market and respond to competitor behaviour.
Consequence views
Where the decisions land in the numbers.
After teams commit to their operating plan, Providence generates the financial consequences. These are not simplified scorecards—they are working IFRS 17 statements, roll-forwards and a market valuation that the facilitator can debrief against.
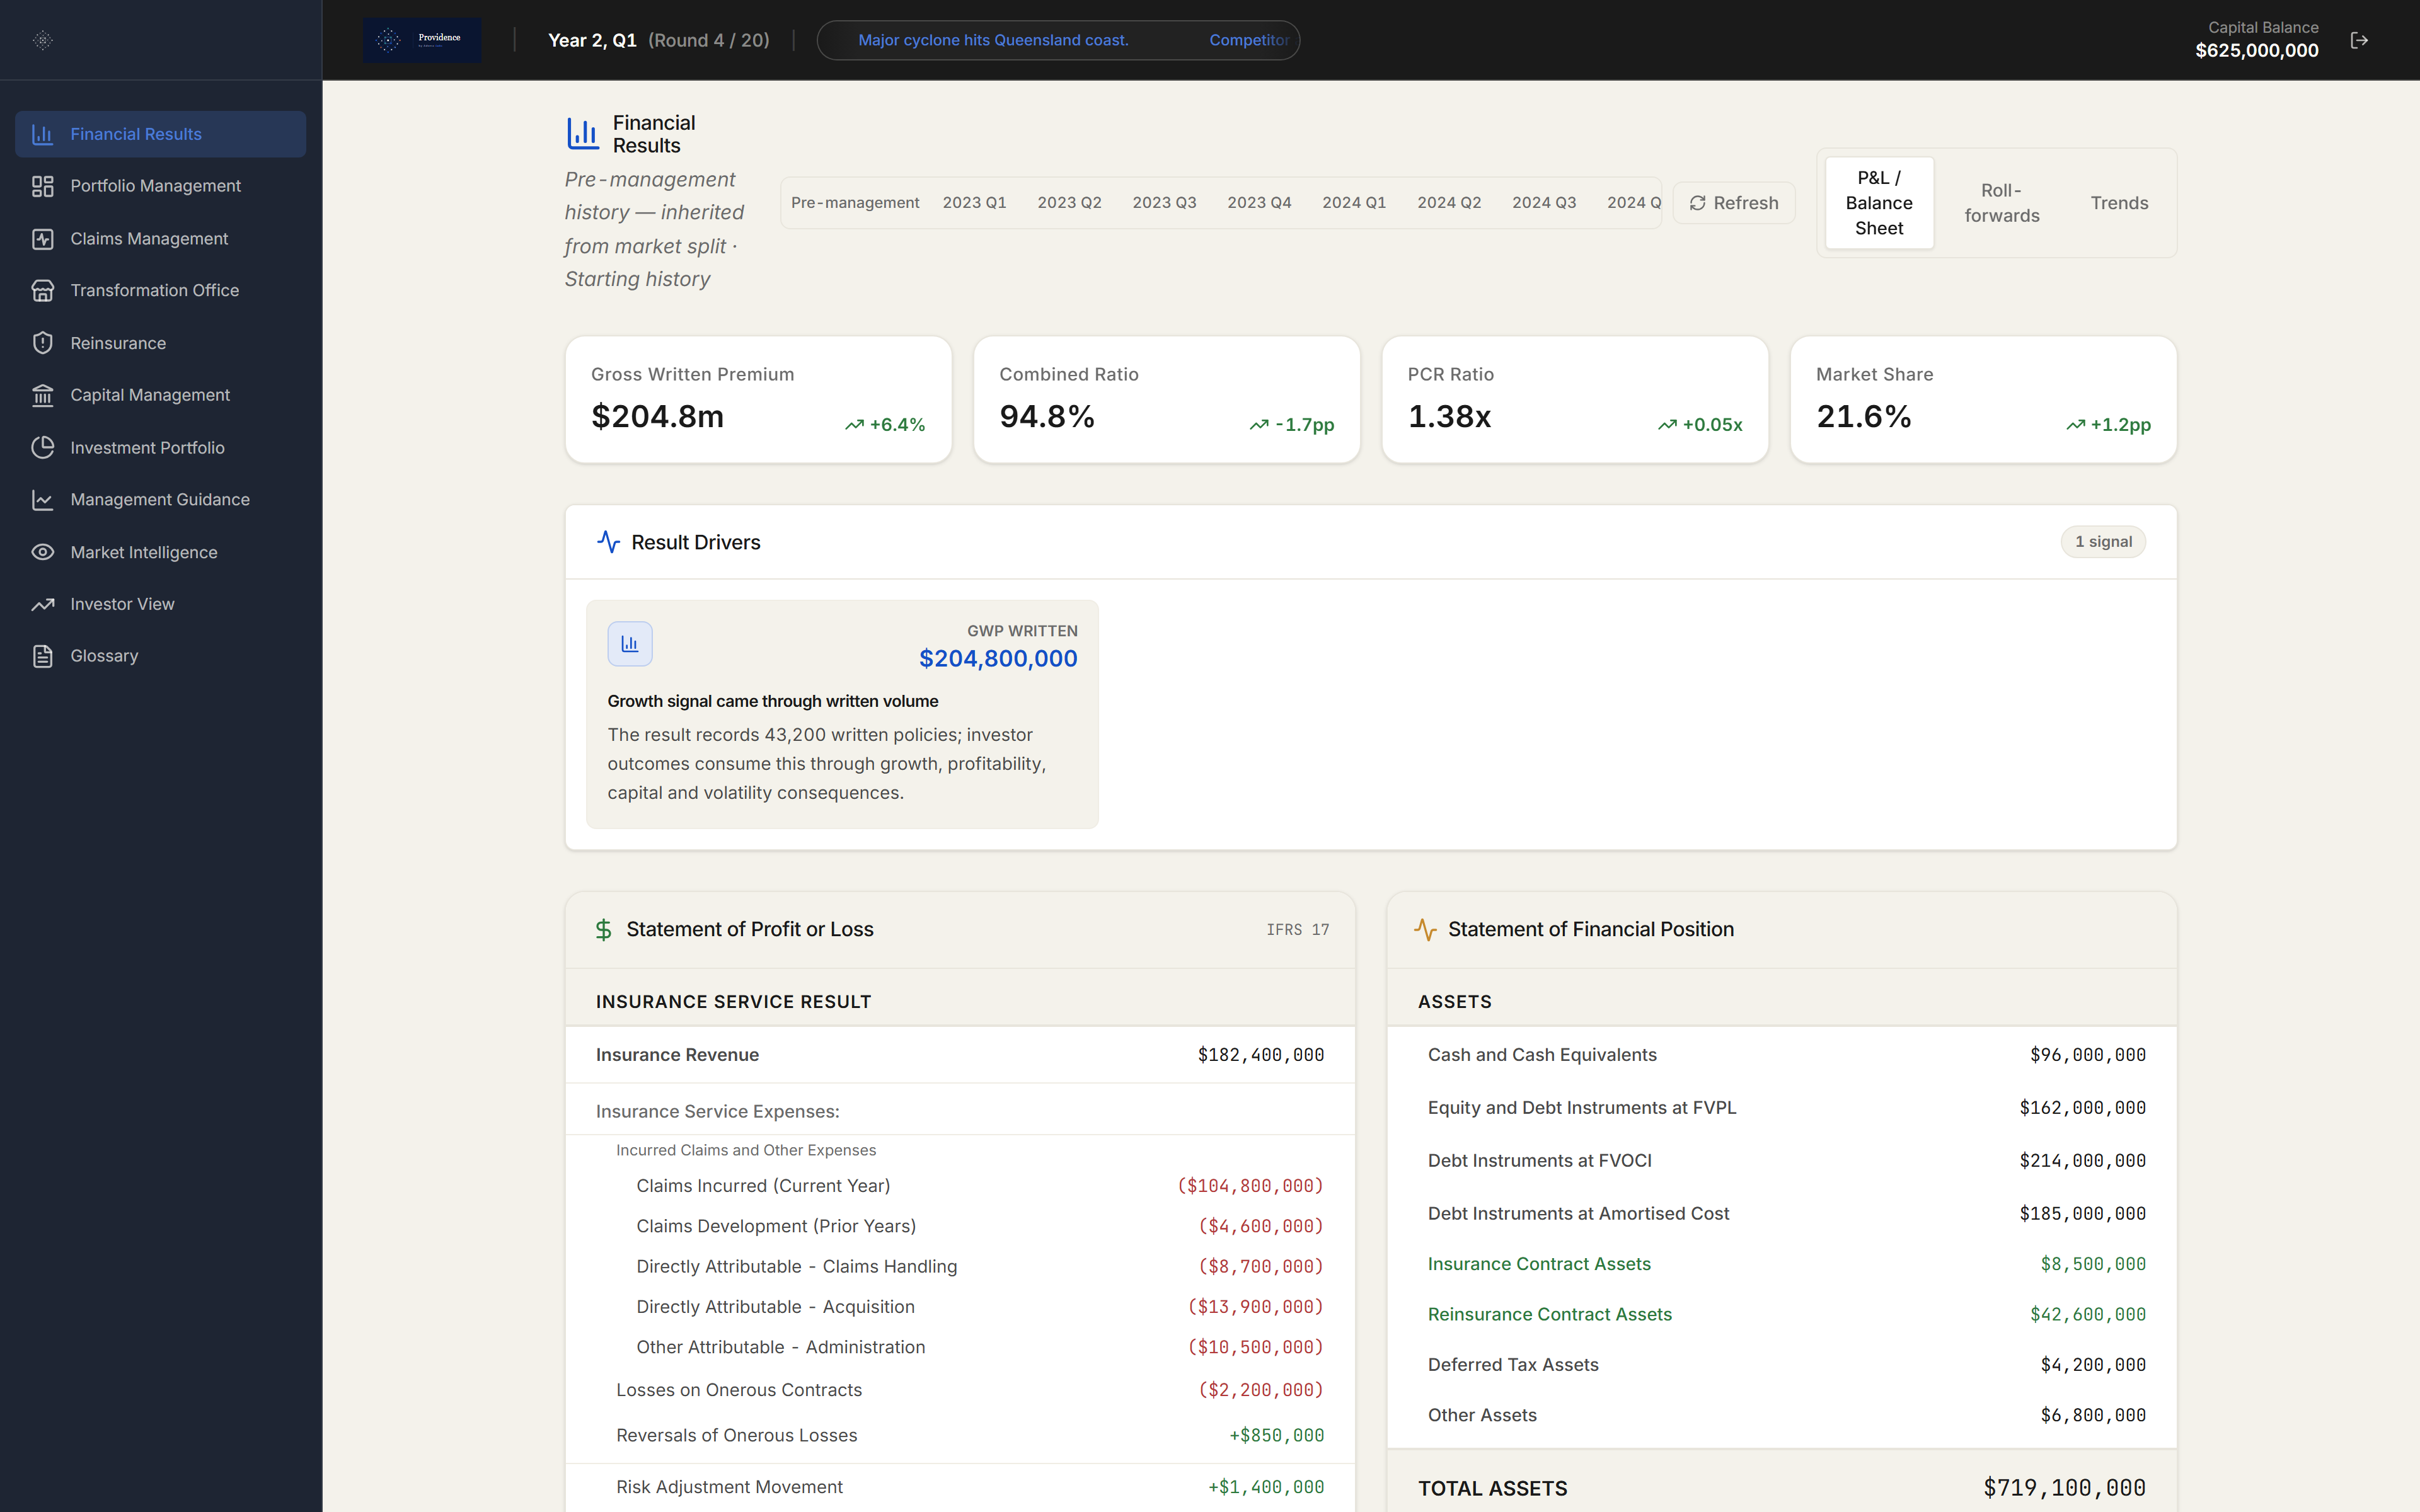
Financial Results
Insurance P&L
The P&L gives the debrief somewhere concrete to land. Teams do not just see whether profit went up or down; they see which operating movements created the result.
Pricing, claims, reinsurance, capital and assets appear in one connected statement, making trade-offs visible in financial language.
Financial Results
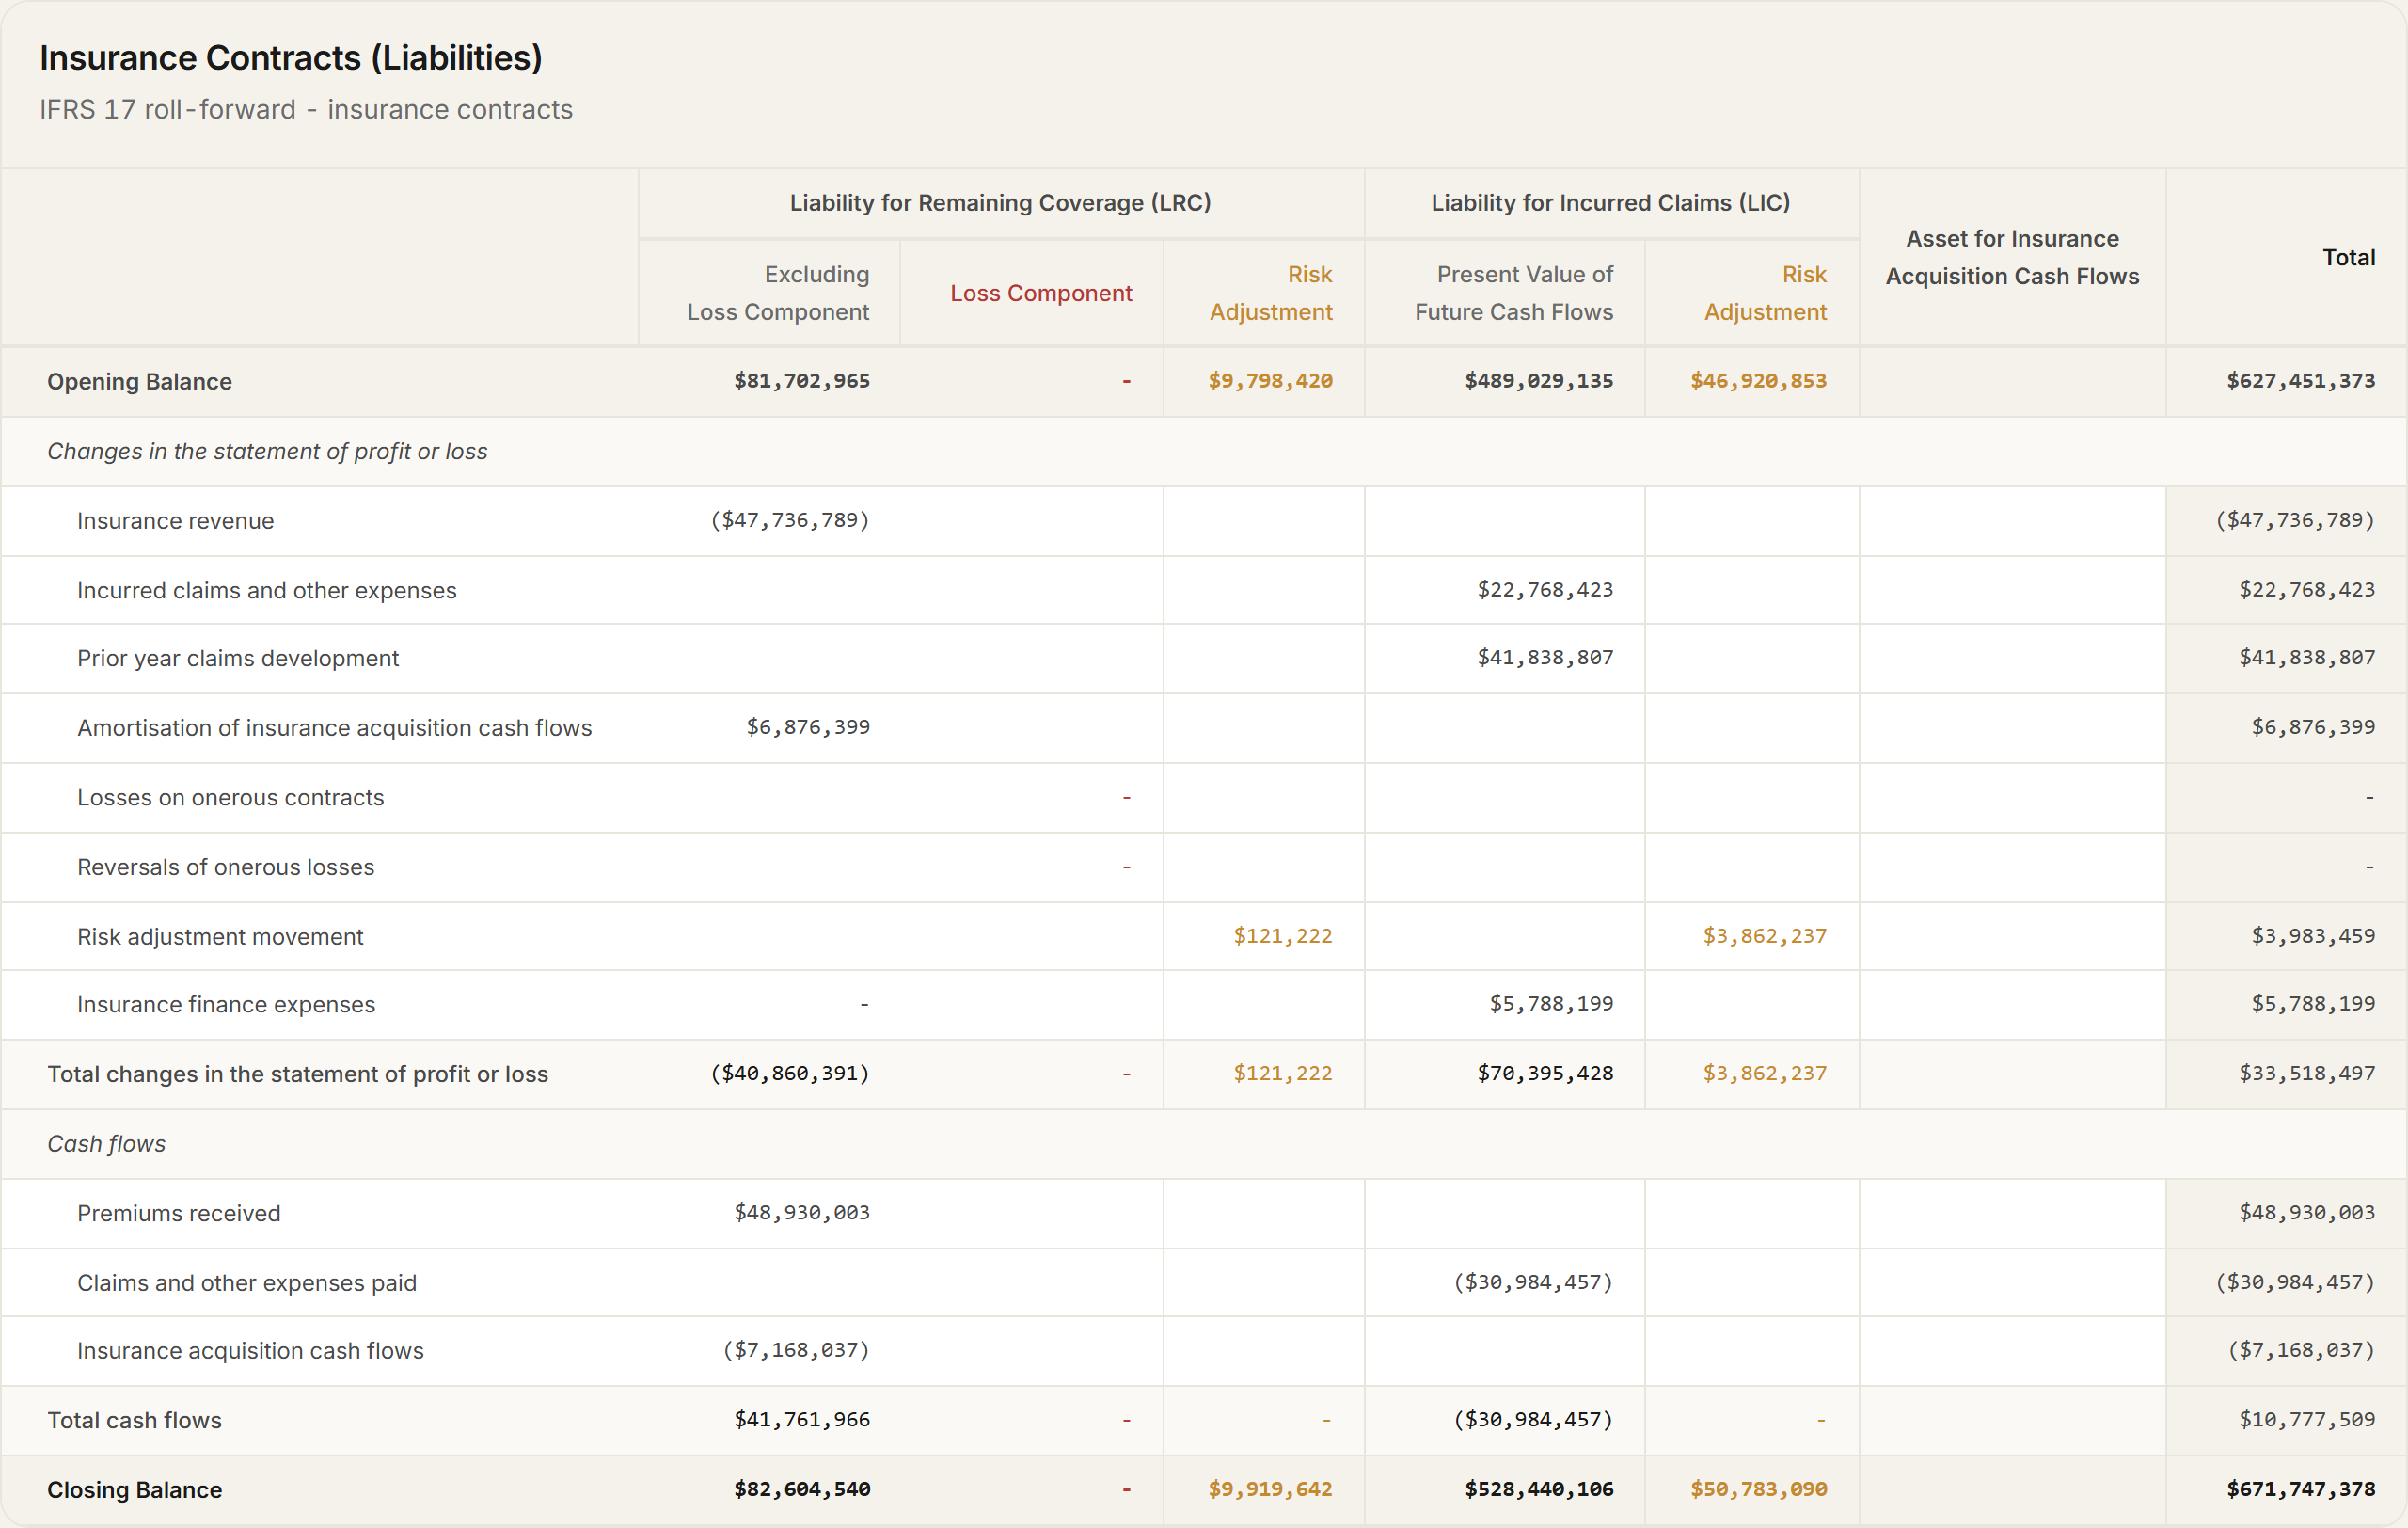
IFRS 17 insurance roll-forward
The insurance roll-forward makes timing visible. Premium earning, claims, onerous components, risk adjustment, finance and cash movements all have to reconcile.
Closing balances tie to the balance sheet and carry into the next quarter, so one round's decisions become the next round's starting position.
Financial Results
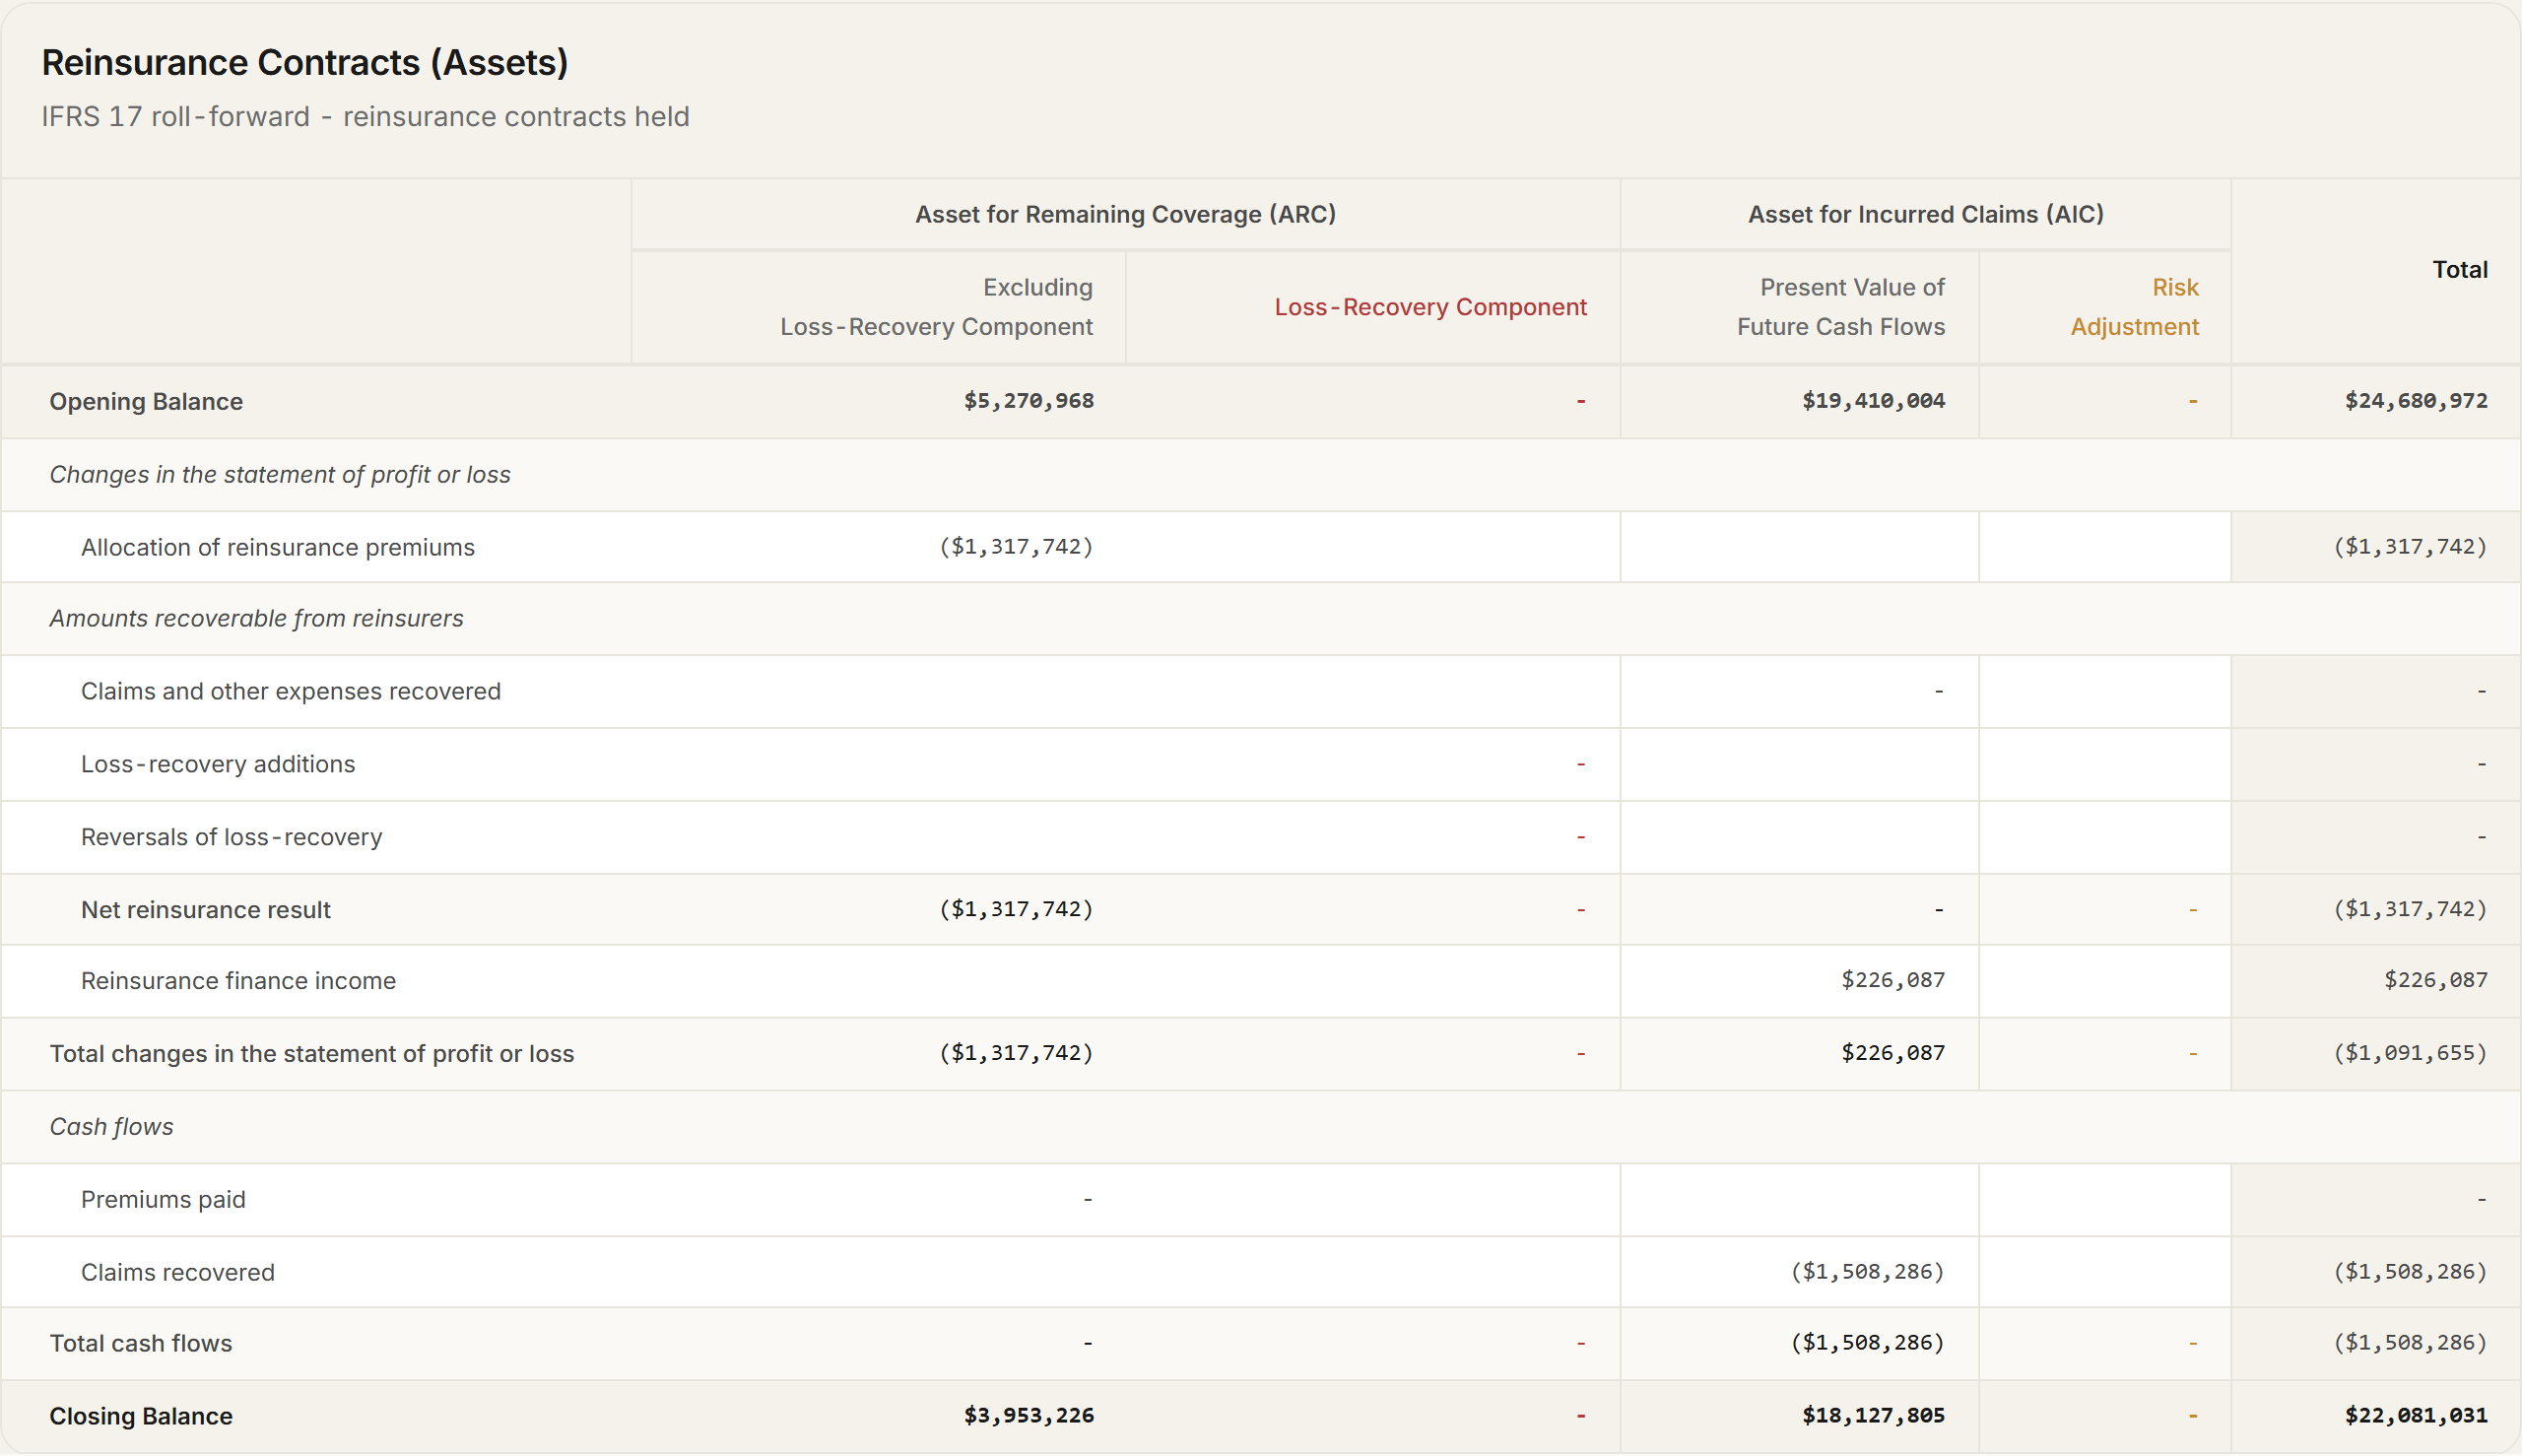
Reinsurance contracts held
The reinsurance asset view keeps gross and ceded economics separate. Premiums paid, recoveries, loss-recovery components and finance income are traced through their own roll-forward.
That separation matters in the debrief: the reinsurance result has to reconcile back to the gross insurance view, not sit beside it as a black-box adjustment.
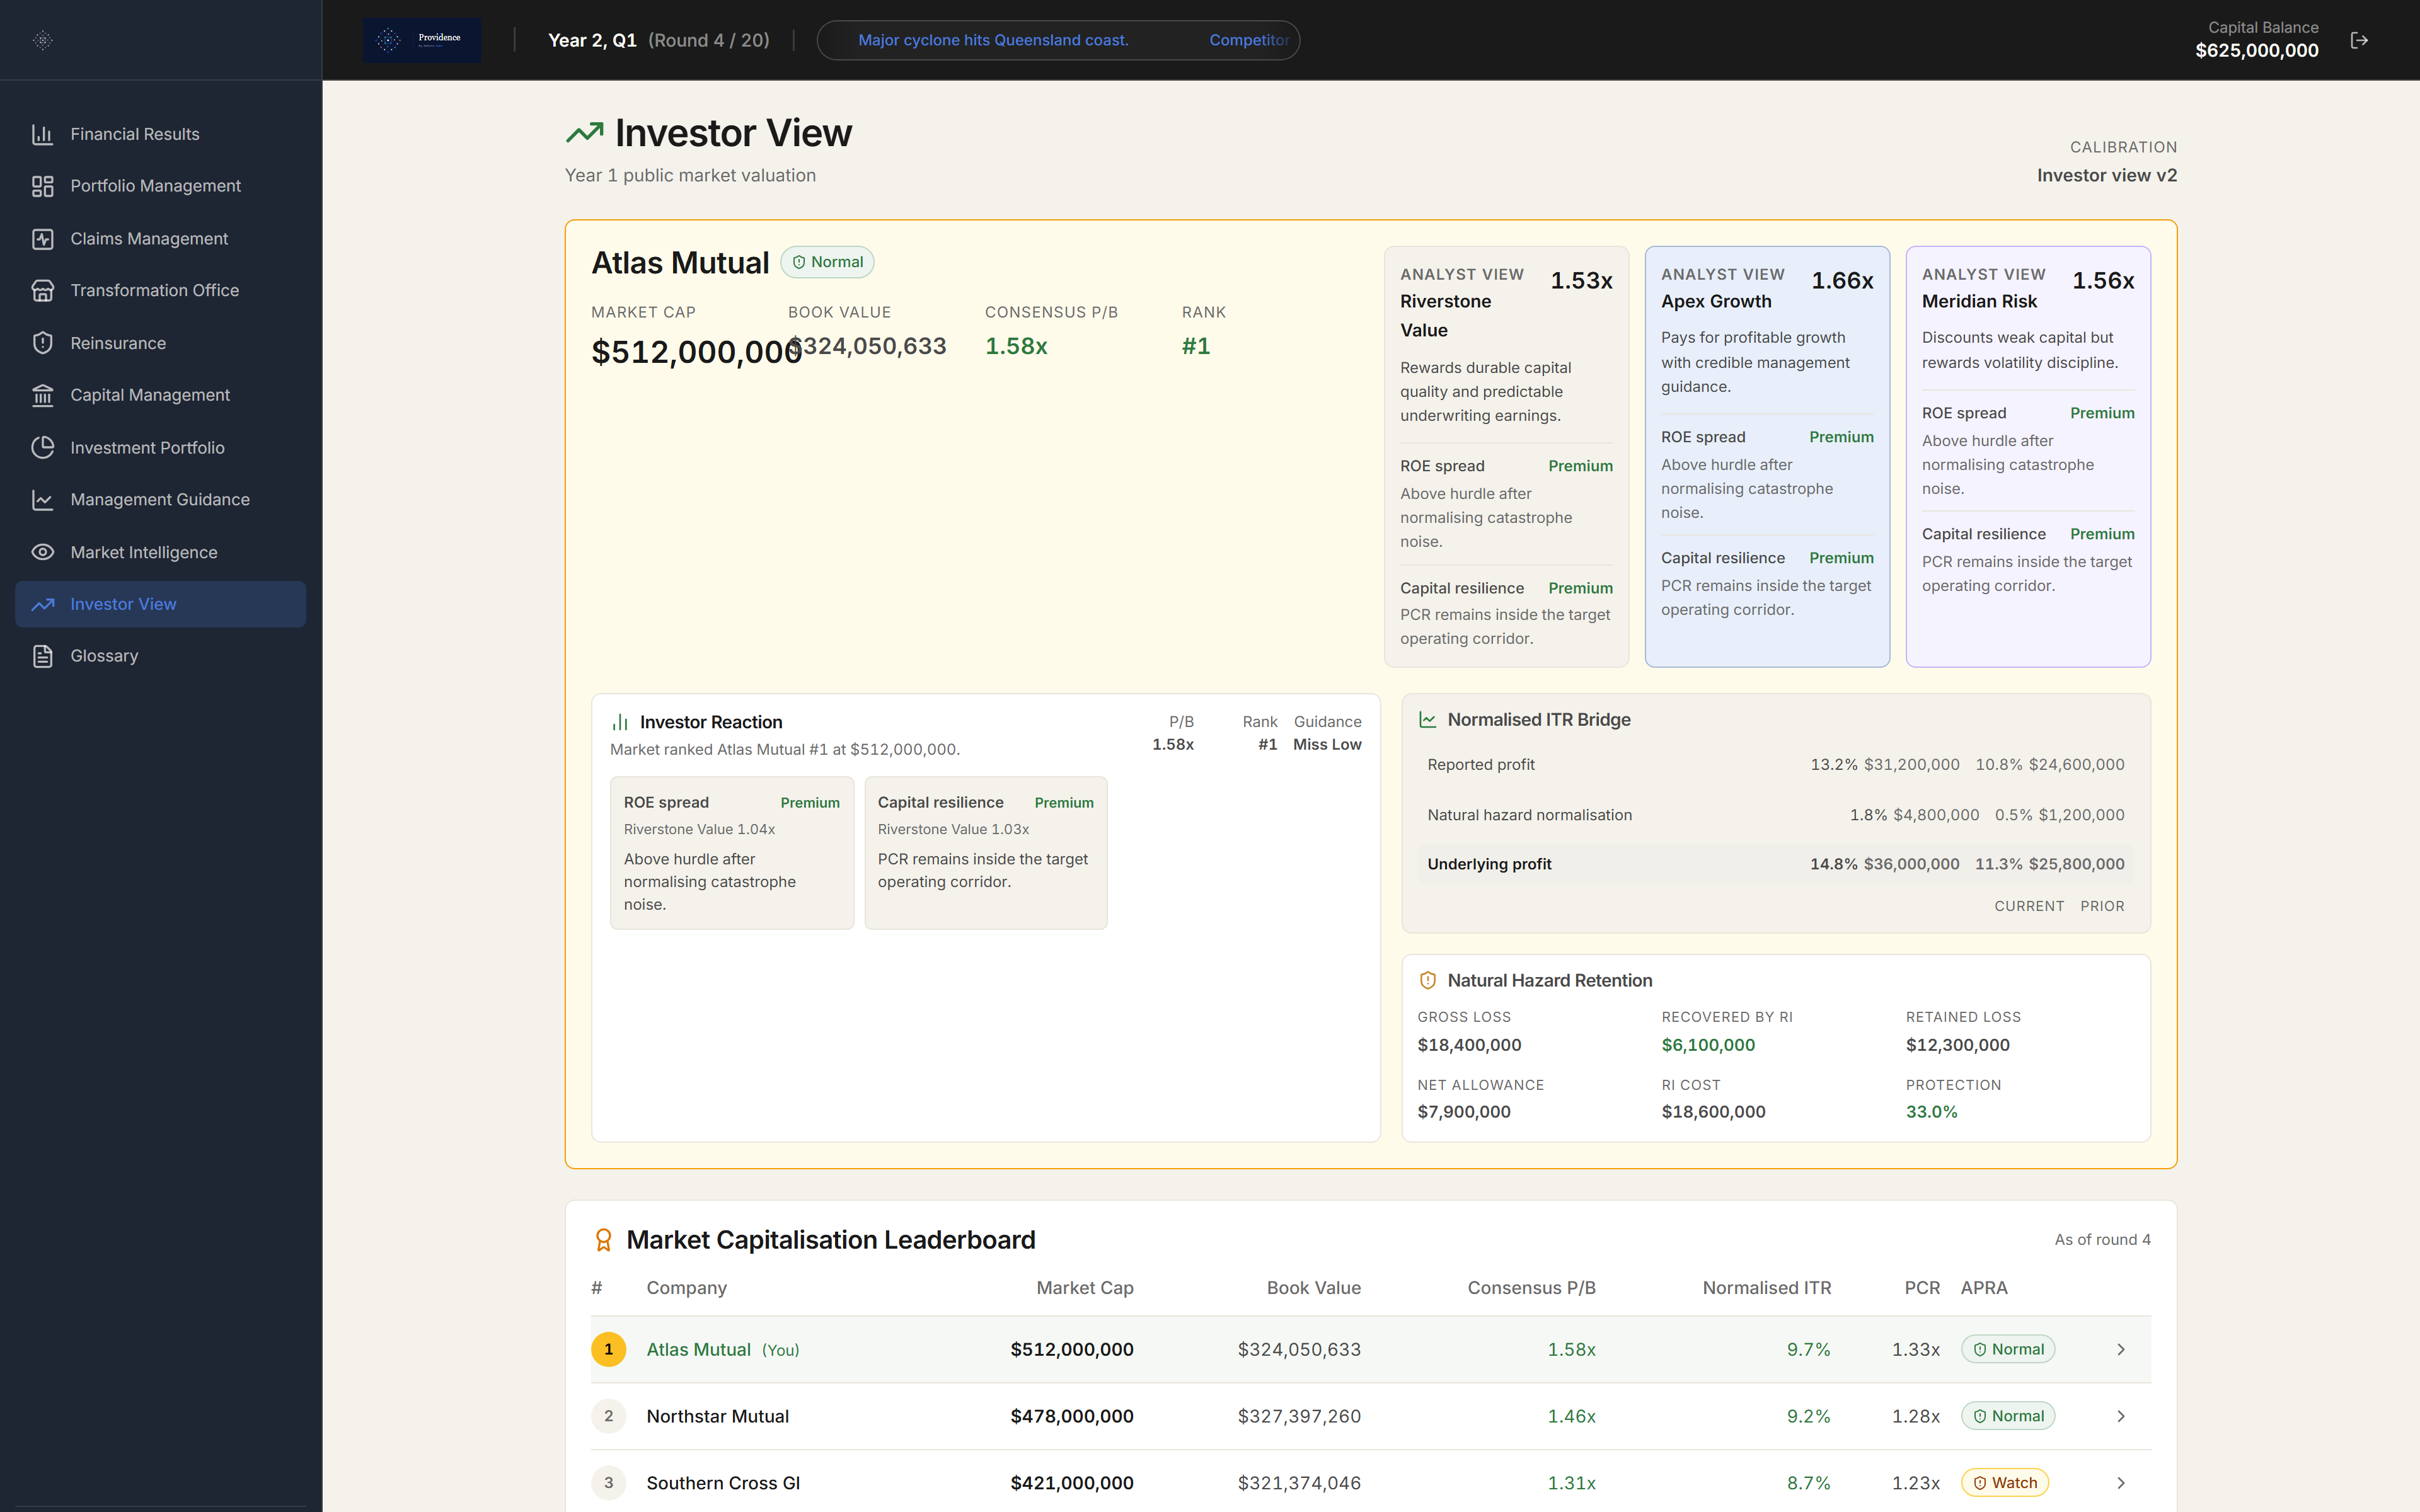
Investor View
Enterprise value and final ranking
Investor View brings the operating story back to enterprise value. Profitability, capital strength, guidance credibility and risk signals all feed the final market view.
The outcome is not one strong quarter. The debrief tests whether teams built durable value or only borrowed performance from the future.
Debrief layer
The result is not a score. It is a working insurer.
After each simulated year, Providence gives the facilitator a shared evidence base. Teams can see the portfolio they wrote, the claims that developed, the reinsurance that responded, the capital that remained and the value they created or lost.
Financial statements
P&L, balance sheet, KPIs and roll-forwards connect operating choices to the numbers a leadership team would have to explain.
Market evidence
Market and competitor views show how the rest of the market responded and whether the team had enough information to understand it.
Investor response
Profitability, capital strength, guidance credibility and public risk signals come together in the final valuation outcome.
Pilot format
A shared operating model for the cohort.
A facilitated session gives participants a common language for how an insurer actually works. Decisions are explicit, the market responds and the financial consequences stay available for debrief.
Before the room
The facilitator configures the scenario, starting history and learning objectives. Every team starts from the same opening position with a live balance sheet and a competitive market already in motion.
Inside the room
Teams work through the decision surfaces, submit their annual operating plan, then watch the market respond quarter by quarter. Published evidence between rounds forces teams to adapt—the plan they committed to may no longer fit the market they face.
After each year
The facilitator debriefs using the full evidence base: financial statements, IFRS 17 roll-forwards, claims development triangles, market intelligence and the final valuation. Each team's decisions are connected to the trade-offs that appeared in their results.
Pilot cohorts
Build commercial judgement across the whole insurer.
Providence gives cross-functional teams a shared understanding of how an insurer actually works—how pricing connects to claims, how reinsurance connects to capital and how every decision eventually lands in the financial statements and the market valuation.
If you contact Advera Labs by email, the information you provide will be used only to respond to your enquiry.